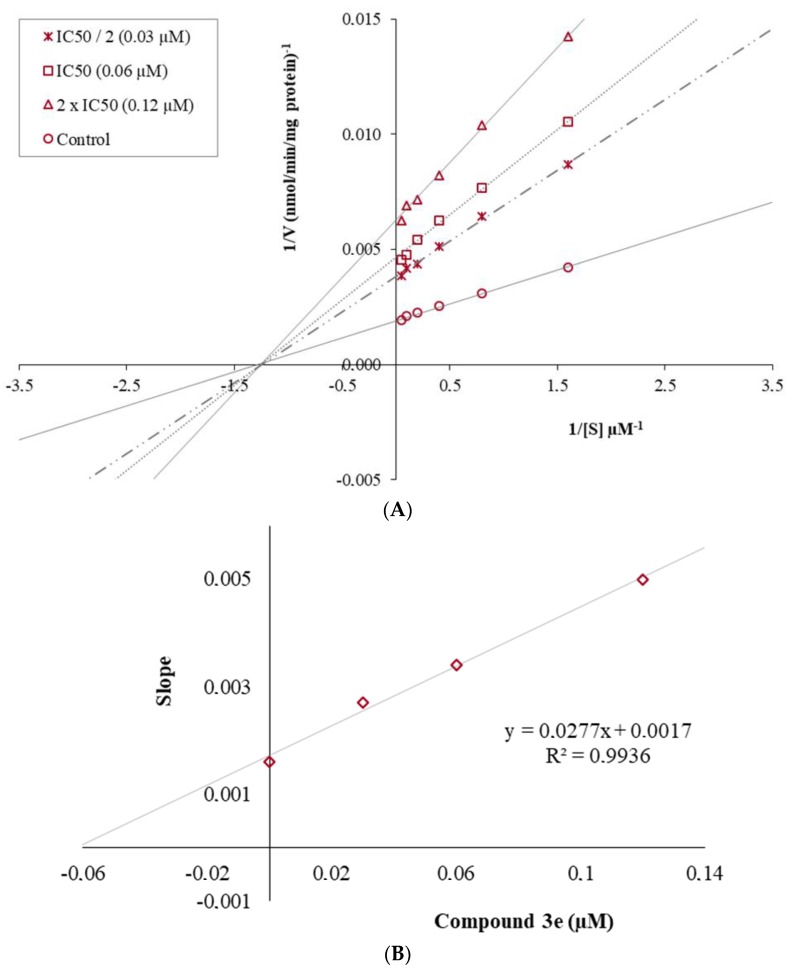
Figure 2.
(A) Lineweaver–Burk plots for the inhibition of hMAO B by compound 3e. [S], substrate concentration (μM); V, reaction velocity (nmol/min/mg protein). Inhibitor concentrations are shown at the left. Vmax values from 2 × IC50 to Control; 158.730, 212.766, 263.158, and 526.316 (nmol/min/mg protein). Km value of the non-competitive inhibition; 0.767±0.031 (µM). (B) Secondary plot for the calculation of the steady-state inhibition constant (Ki) of compound 3e. Ki was calculated as 0.061 μM.

