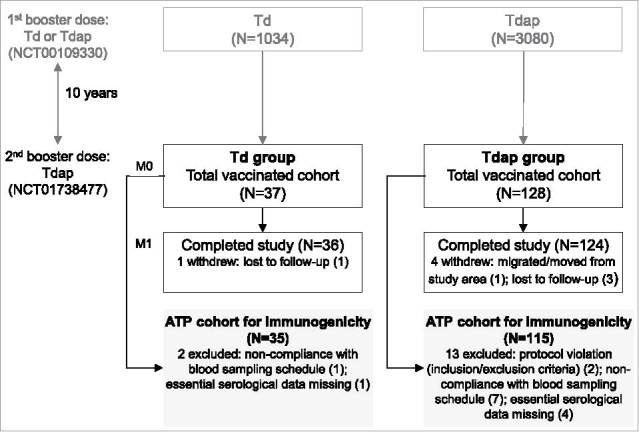
Figure 1.

Participant flowchart. Footnote: Td group, participants receiving Td as first booster dose in the primary study and Tdap as decennial booster dose (second booster dose) in the current study; Tdap group, participants receiving Tdap booster doses 10 years apart; N, number of participants in each group; M, month; ATP, according-to-protocol.
