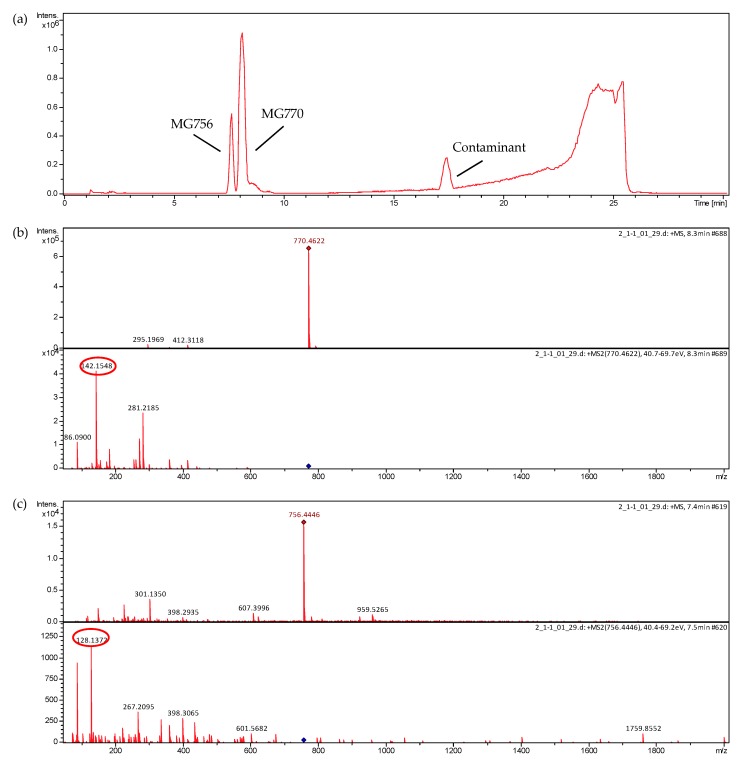
Figure 3.
Chromatogram (full scan mode) and MS/MS spectra of microginin fraction post-isolation. The spectra were obtained in a Micro-QTOFII mass spectrometer. The product ions of m/z 142 and 128, characteristic of microginins, are circulated. The operation conditions are described in the materials and methods section. (a) Full scan MS chromatogram; (b) MS/MS spectrum of MG 756; and (c) MS/MS spectrum of MG 770.

