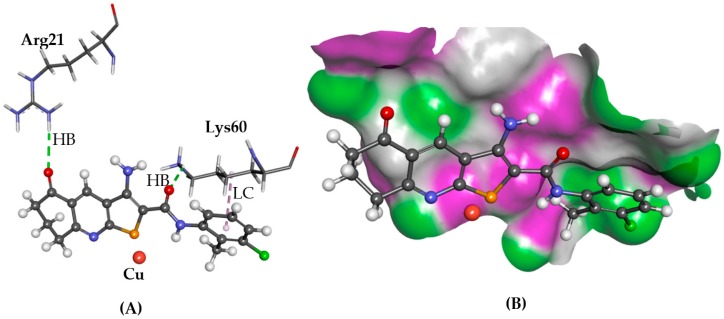
Figure 4.
The docked conformation of 1 to the binding site of ATOX1 using GS. (A) Hydrogen bonds (HB) are depicted as green dotted lines between 1 and the amino acid Arg21. Furthermore, a lipophilic contact (LC) is shown as purple dashed lines between Lys60 and derivative 1; (B) 1 shown in the binding pocket with the protein surface rendered. Purple represents hydrogen bond donor regions and green depicts hydrogen bond acceptor regions.

