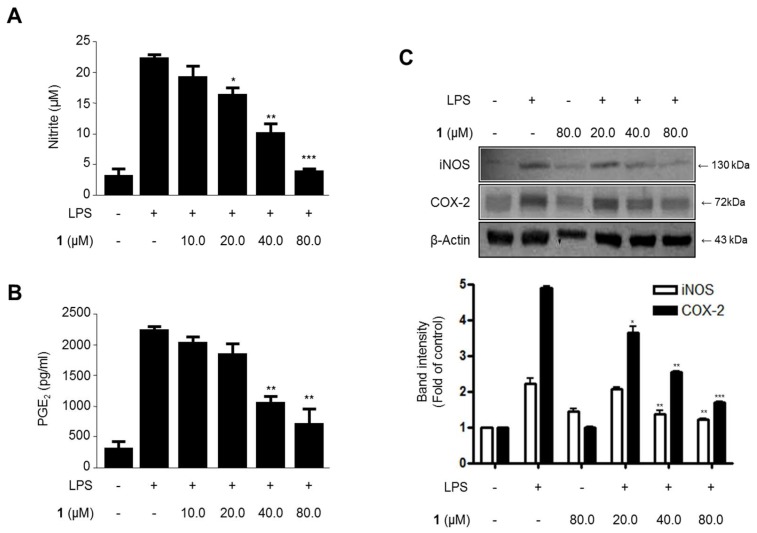
Figure 4.
The effects of steppogenin (1) on nitrite (A) and prostaglandin E2 (PGE2) (B) production and iNOS and COX-2 expression (C) in lipopolysaccharide (LPS)-stimulated BV2 microglial cells. (A–C) The cells were pretreated for 3 h with the indicated concentrations of 1 and then stimulated for 24 h with LPS (1 μg/mL). The data are presented as the mean ± SD of three experiments. The band intensity was quantified by densitometry and normalized to the intensity of the β-actin band; the normalized values are presented below each band. * p < 0.05; ** p < 0.01; *** p < 0.001 compared with the LPS-treated group.

