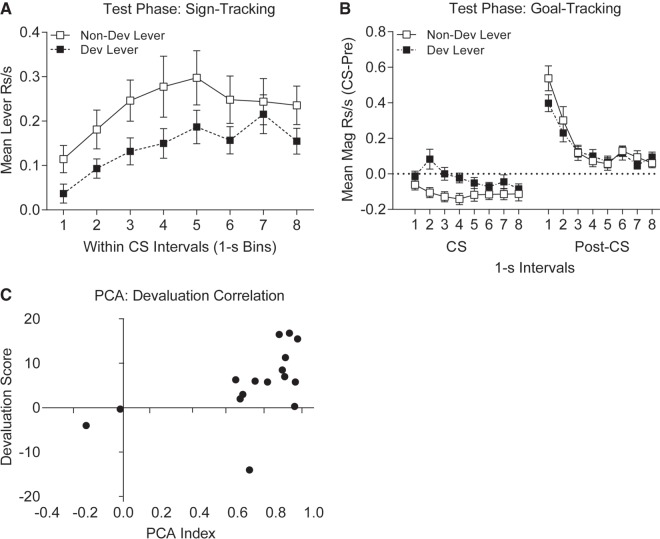
Figure 2.
Experiment 1, devaluation testing. (A) Mean lever contacts (sign-tracking) shown in 1-sec intervals across CS presentation interval during devaluation testing. Contacts with the lever whose US was devalued (solid symbols) is lower than the lever whose US was left nondevalued (empty symbols). (B) Mean magazine responses (goal-tracking) shown in 1-sec intervals across CS presentation interval and during the post-CS period. During CS presentation magazine responding is greater to presentation of the devalued versus nondevalued CS, but this pattern flips in the post-CS period, such that at the time of expected US delivery magazine responding to the nondevalued CS is greater than the devalued CS. (C) The relationship between the US devaluation score and the Pavlovian conditioned approach score (PCA) for individual animals. The propensity to sign-tracking is positively correlated with the magnitude of devaluation score.

