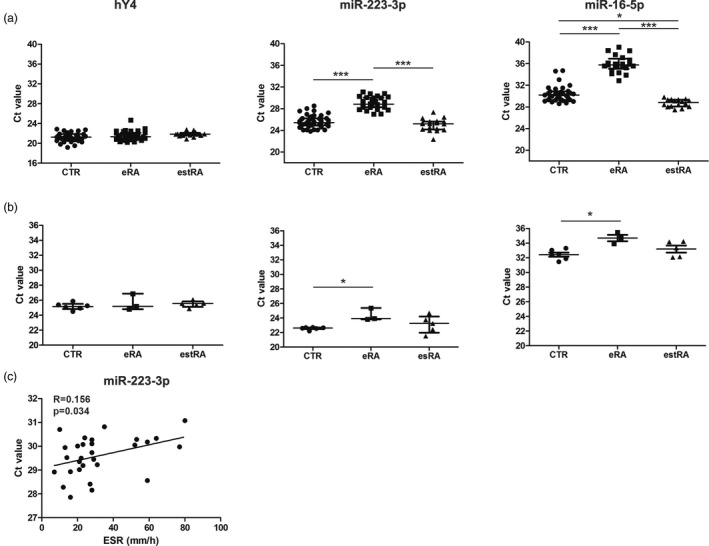
Figure 3.

Reverse transcription–quantitative polymerase chain reaction (RT–qPCR) analysis of the 5′‐end of hY4 RNA, miR‐223‐3p and miR‐16‐5p in rheumatoid arthritis (RA) and control (CTR) sera. Small RNAs were isolated from frozen sera and the presence of the 5′‐end fragment of hY4 RNA, miR‐223‐3p and miR‐16‐5p was determined by the miR‐Q approach (a). miR‐Q analyses of the same small RNAs in fresh sera from eRA and estRA patients and from CTR individuals (b). Spearman’s correlation between serum miR‐223‐3p levels in eRA patients and ESR (c). Spearman’s coefficient (r) is shown along with its significance (P‐value). The Mann–Whitney two‐sample tests were performed to examine the differences between RA and CTR (*P < 0·05; ***P < 0·001); n.s. = non‐significant.
