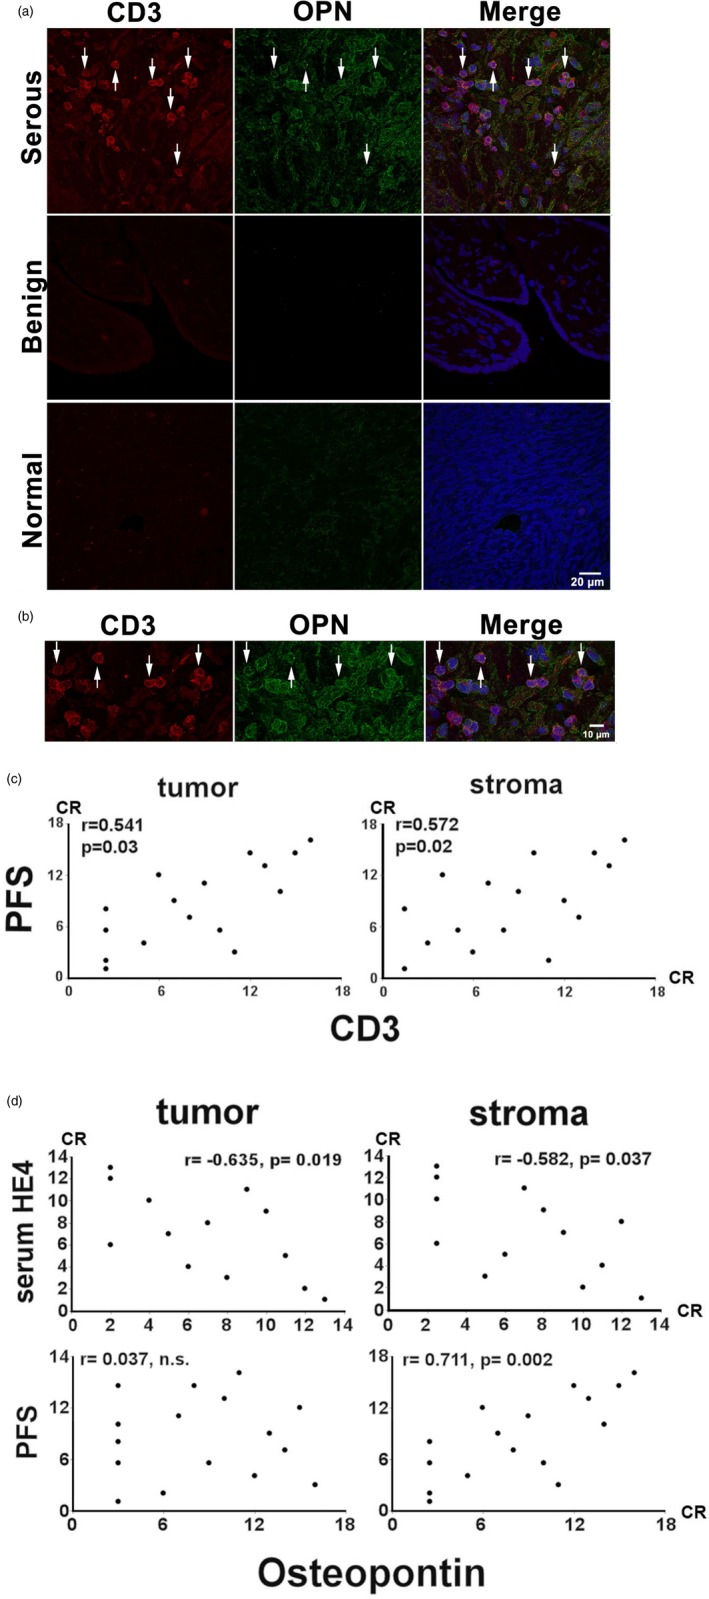
Figure 5.

Confocal immunoflurescent analysis of CD3 (DyLight 595, red) and osteopontin (OPN) (DyLight 488, green) expression in biopsy samples. Twenty biopsies (listed in Table 3) were evaluated. (a) Stromal and tumoral CD3+ cells and OPN+ tumour cells are indicated by arrowhead. A biopsy from a benign serous tumour (benign) and an uninvolved section of oophorectomy (normal) were utilized as a negative control. (b). Enlarged image depicting image co‐staining of stromal and tumoral CD3+/OPN+ T cells in their cytosol or the surrounding area (c,d). Graphic representations of Spearman’s rank correlations between the numbers of CD3+ or OPN+ cells and clinical parameters. CR = corrected ranks.
