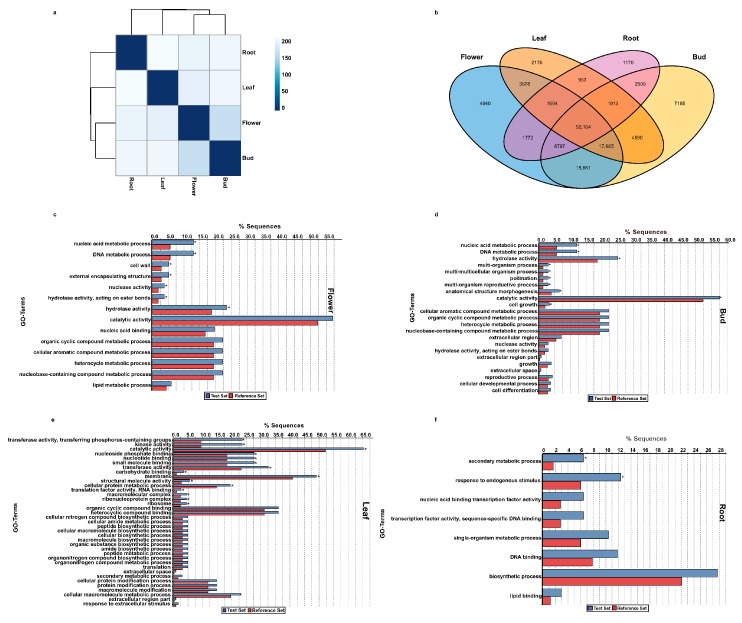
Figure 6.
Transcriptome expression analysis across four tissues. (a) Euclidean distance-based hierarchical clustering using expression value of unigenes with non-zero FPKM across four tissues of A. carmichaelii; (b) Venn diagram of tissue-specific unigenes (FPKM > 0); (c–f) GO enrichment analysis for tissue-specific unigenes. Using tissue-specific unigenes as a test set and unigenes of A. carmichaelii with GO annotation as a reference set, gene ontology enrichment analysis was performed using Fisher’s exact test with the p value cut-off set as < 0.05. * represents enriched GO terms with FDR < 0.05.

