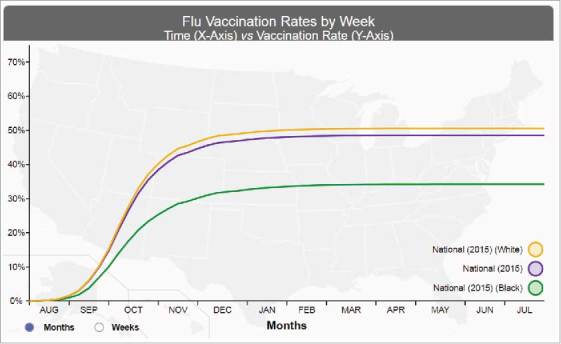
Figure 1.

Screenshot of the national flumap vaccination coverage estimates by week. This screen shot enables users to display vaccination rates in accordance to selected color-coded attributes to yield trends, a visual display of near-real time national vaccination coverage rates for influenza vaccination by selected race, 2015–2016. Source: https://www.hhs.gov/nvpo/about/resources/interactive-mapping-tool-flu-vaccination-claims-by-week/index.html?language = en.
