
FIGURE 4.
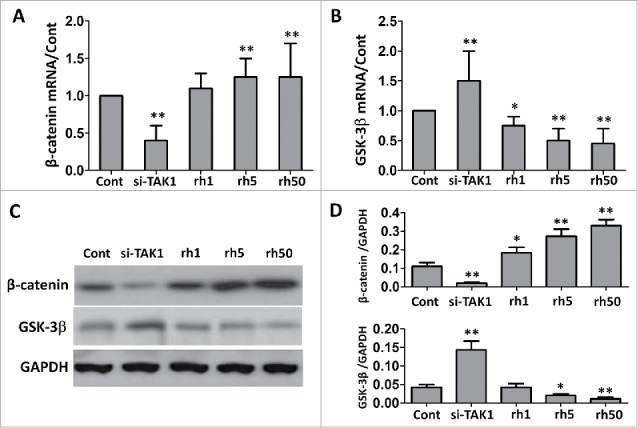
Effect of TAK1 on the expression levels of β-catenin and GSK-3b during osteogenic differentiation of MSCs. qRT-PCR (A, B) and western blot (C, D) analysis of the genes and corresponding proteins. GAPDH was used as an internal control. Cells were plated at a density of 2 × 10⁴ cells/cm2 in 6-well plates. After 2 days, the medium was replaced with an osteogenic -inducing medium. Then, the cells were transfected with si-TAK1, or added with 1 ng/ml rhTAK1 (rh1), 5 ng/ml rhTAK1 (rh5) or 50 ng/ml rhTAK1 (rh50), respectively, for 14 days. Values are expressed as means ± S.E.M. of three independent experiments. *p < 0.05, **p < 0.001, compared with control.