FIGURE 5.

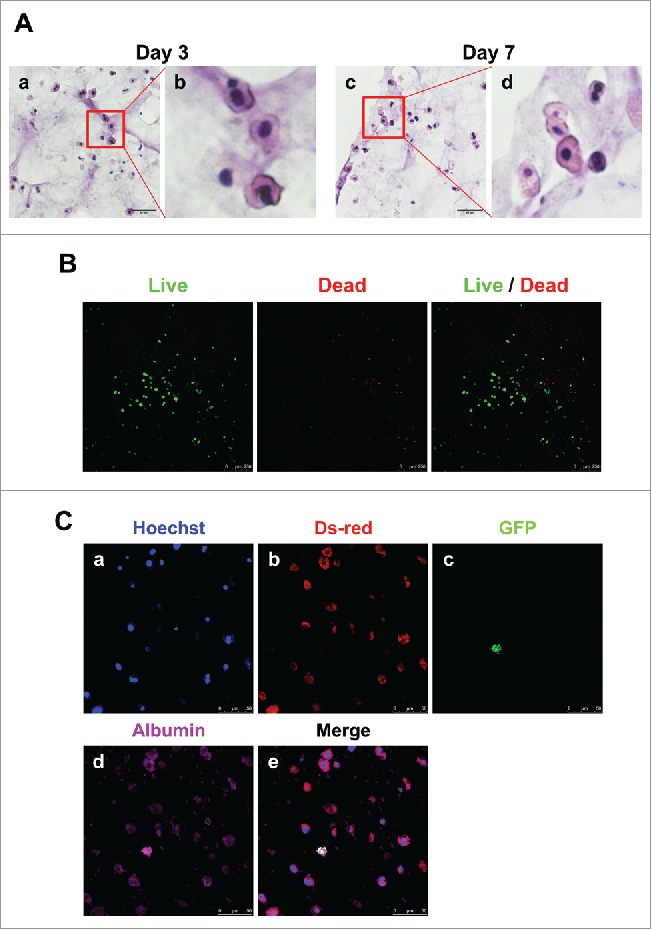
Detection of hepatocytes and MSCs in 3D architecture by H&E staining, live/dead assay and immunostaining. (A). H&E staining at day 3 (a, enlarged in b) and 7 (c, enlarged in d). Bars, 60 μm. (B). Live/Dead Viability/Cytotoxicity Assay. Live cells (Green) and Dead cells (Red). Bars, 50 μm. (C). Immunofluorescent staining for DsRed (b), GFP (c) and albumin (d) at day 7. Hoechst (blue; a) labels all nuclei. Bars, 50 μm.
