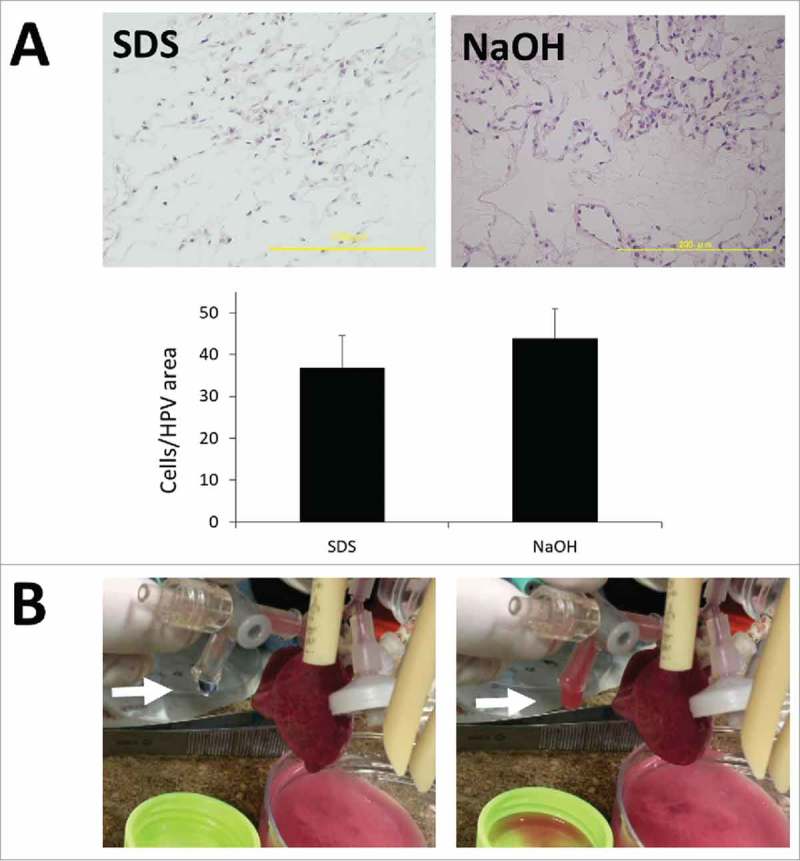
FIGURE 5.

(A) Histopathological findings of SDS-treated and NaOH-treated recellularized lung. Scale bar = 200 μm. Bar graph showing the average number of reseeded HUVECs within a high power view (HPV) area (P = 0.310). (B) Findings of gas exchange functional analysis. Note hemoglobin vesicles-PBS solution was harvested from the cannulated pulmonary vein (white arrow).
