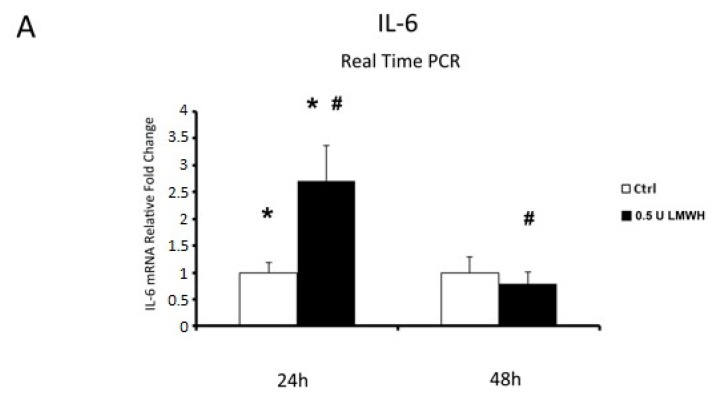
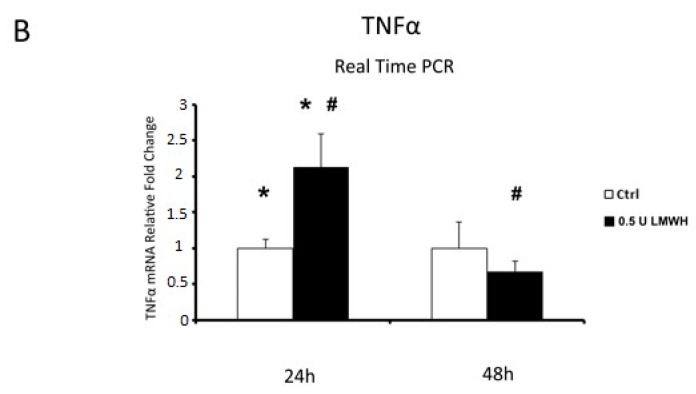
Figure 6.
IL-6 and TNFα mRNA expression in LMWH-treated explants vs. controls assessed by Real Time PCR. (A) IL-6 gene expression in villous explants treated by 0.5 U of LMWH for 24 h (ctrl n = 8 and 0.5 U LMWH n = 10) and 48 h (ctrl n = 11 and 0.5 U LMWH n = 10). (B) TNFα gene expression levels in villous explants treated by 0.5 U of LMWH for 24 h (ctrl n = 8 and 0.5 U LMWH n = 10) and 48 h (ctrl n = 11 and 0.5 U LMWH n = 10). Statistical significance (*#) has been considered as p < 0.05.


