
Figure 4.
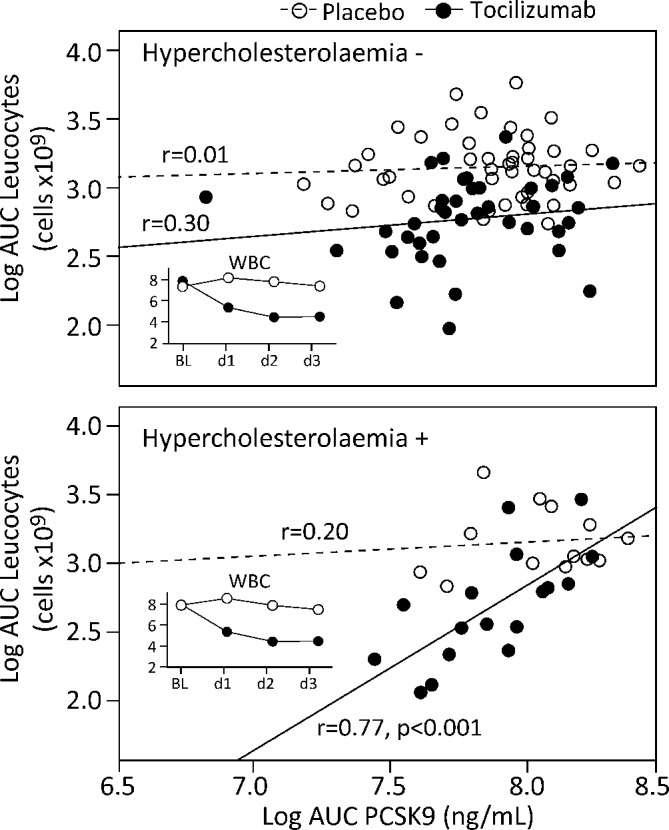
Correlation between AUC during hospitalisation for neutrophils and PCSK9 stratified by absence (top panel) or presence (bottom panel) of hypercholesterolaemia and treatment (clear circles, placebo; filled circles, tocilizumab). Correlation coefficients within each stratification group are given and p value when significant. The small graph in each panel shows the average white cell count within each stratification group according to treatment during hospitalisation. AUC, area under the curve; BL, baseline; PCSK9, proprotein convertase subtilisin-kexin type 9.