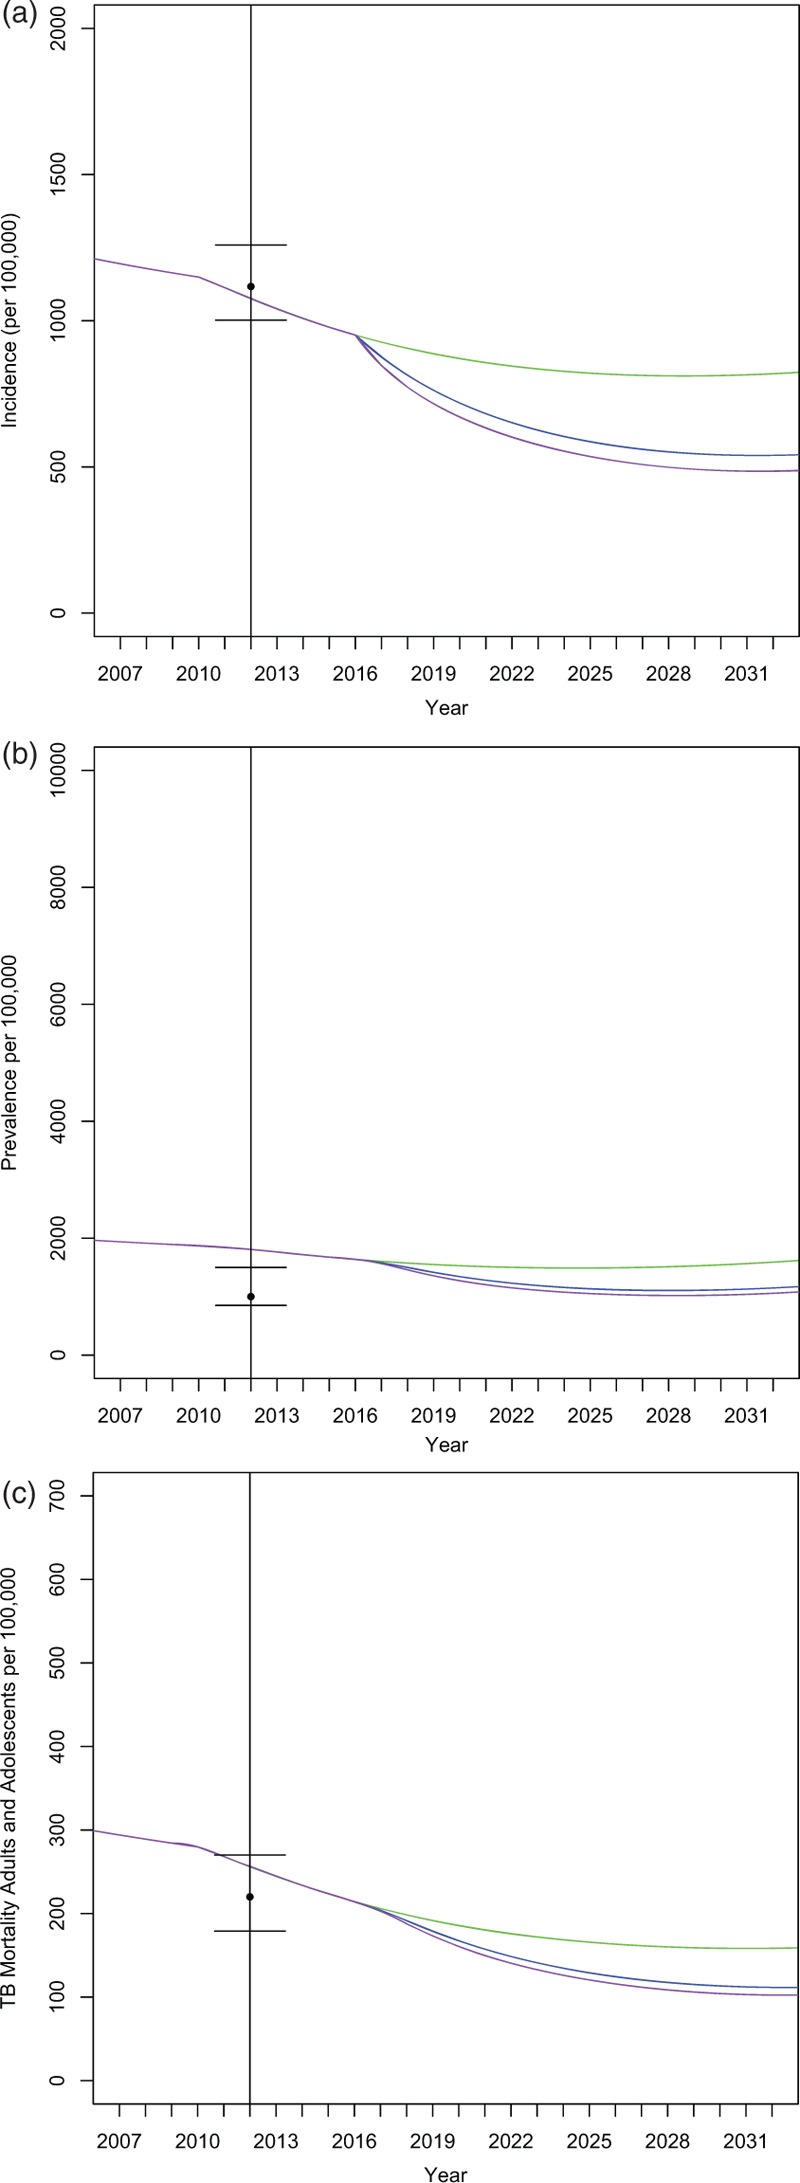
Fig. 2.
Effects of isoniazid preventive therapy on key tuberculosis disease indicators.

Bars indicate calibration target ranges. The baseline isoniazid preventive therapy case is shown in green, 50% isoniazid preventive therapy coverage in the blue intervention line, and 90% isoniazid preventive therapy coverage in the purple intervention line. (a) Tuberculosis Incidence in general population aged 14 and older, (b) tuberculosis prevalence in the general population aged 14 and older, (c) tuberculosis mortality in the general population aged 14 and older.
