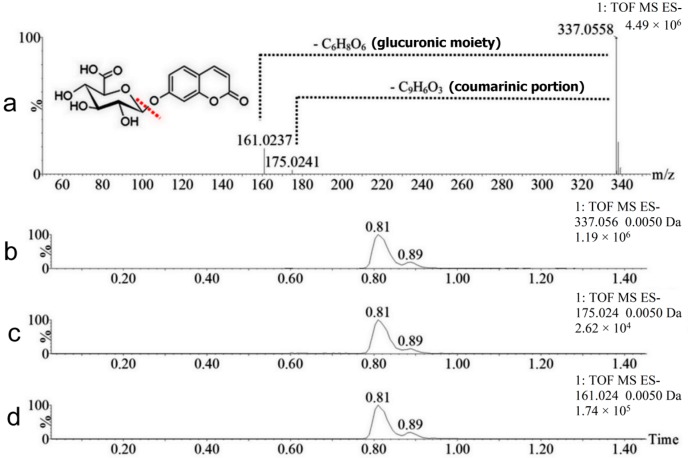
Figure 4.
Mass spectrum and chromatograms of metabolites M1 and M2 (m/z 337.06). Data: alternating collision energy mass spectrum (MSE) of M1 in the negative ionization mode (a); and extracted chromatograms of the ion m/z 337.06 (b); fragment ion m/z 175.02 (c) and fragment ion m/z 161.024 (d). The illustration is to exemplify the fragments of the hydroxycoumarin glucuronide isomers.

