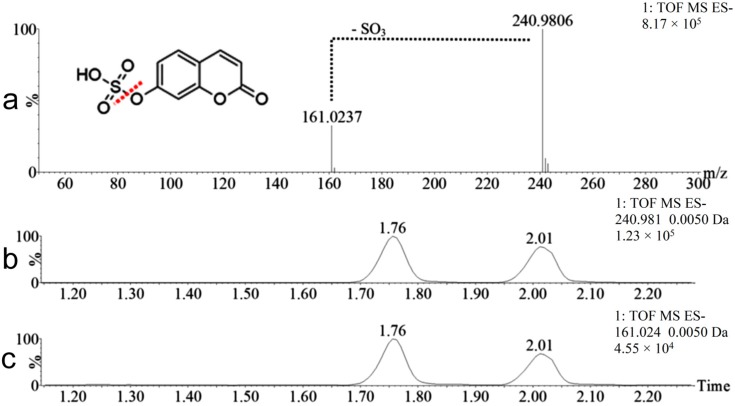
Figure 6.
Mass spectrum and chromatograms of metabolites M3 and M4 (m/z 240.98). Data: MSE mass spectrum of M3 in the negative ionization mode (a), and extracted chromatograms of the ion m/z 240.98 (b) and fragment ion m/z 161.02 (c). The illustration is to exemplify the fragments of the hydroxycoumarin sulfate isomers.

