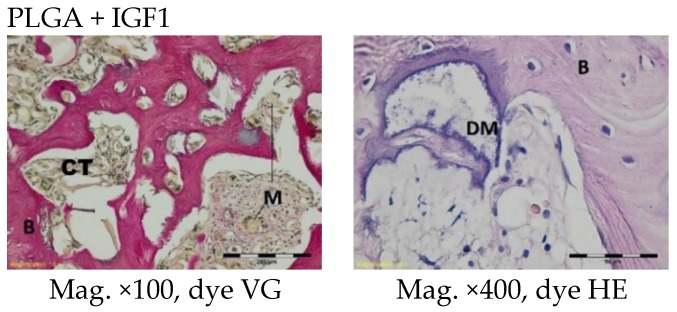
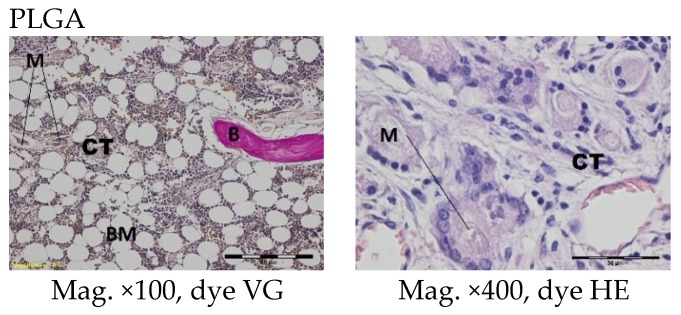
Figure 8.
Microscopic images six months after the implantation of the experimental PLGA + IGF1 and PLGA control. M-material, CT-connective tissue, B-bone tissue, BM-bone marrow, GC-giant cell, DM-decomposition of material. PLGA + IGF1—left image: spongy bone in the edge of the implant; right image: focal disintegration of the material is visible. PLGA—left image: the residues of materials in the bone marrow are visible; right image: granulation tissue around the material.


