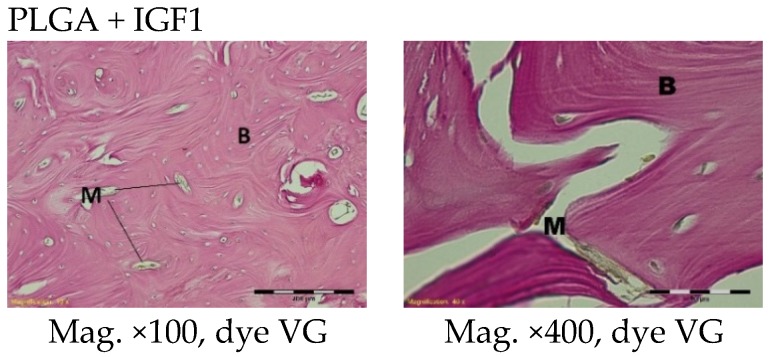
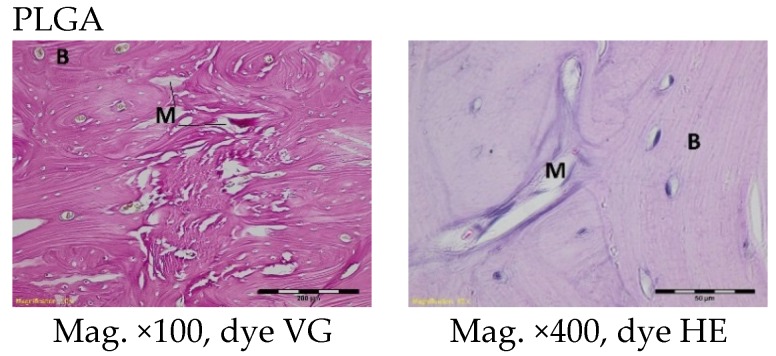
Figure 10.
Microscopic images 12 months after the implantation of the experimental PLGA + IGF1 and control PLGA. M-material, B-bone tissue. PLGA + IGF1—left image: the edge of the implants with the spongy bone; right image: the residue of fibre in trabeculae. PLGA—left image: the edge of the implant; right image: in the trabeculae the residue of material is visible.


