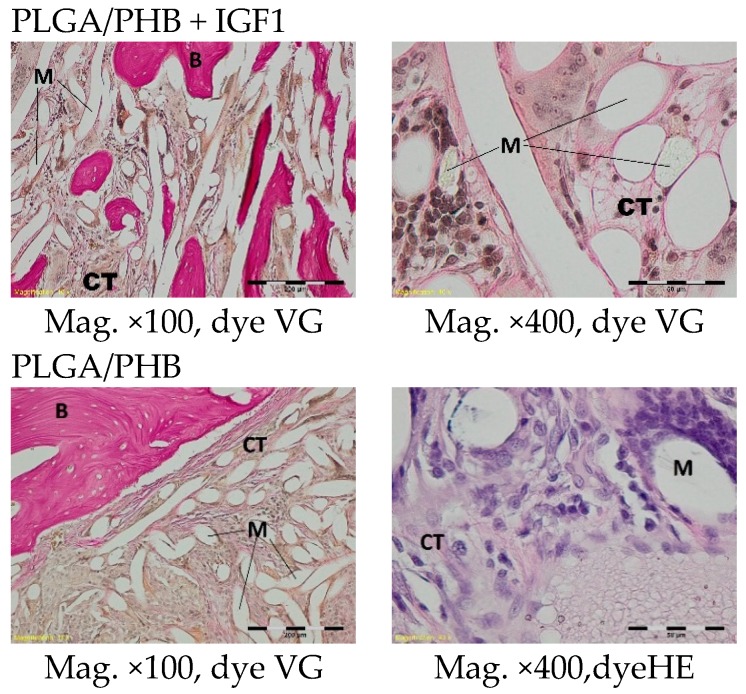
Figure 11.
Microscopic images of bone tissue one month after the implantation of the experimental PLGA/PHB + IGF1 and control PLGA/PHB. M-material, CT-connective tissue, B-bone tissue. PLGA/PHB + IGF1—left image: the edge of the implant with single trabelcure is visible; right image: the connective tissue in the centre of implant is visible. PLGA/PHB—left image: the edge of the implant with connective tissue is visible; right image: the connective tissue in the centre is visible.

