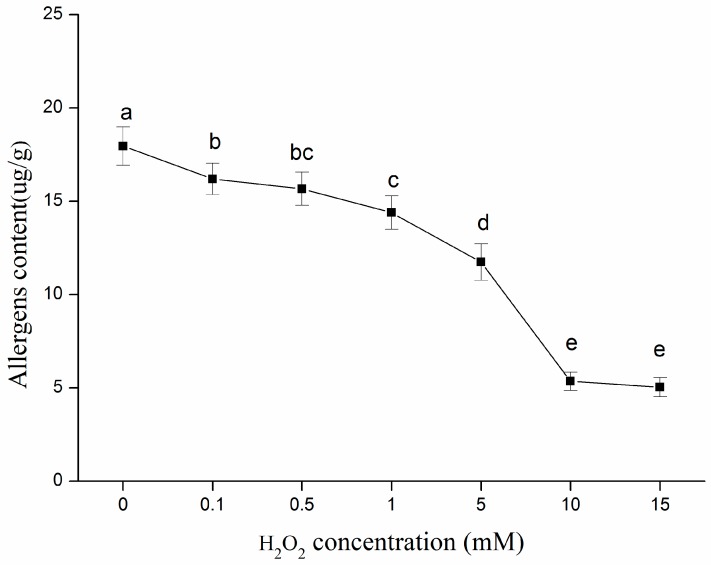
Figure 6.
Changes on average contents of the allergens in native and oxidized β–conglycinin incubated with increasing concentrations of H2O2 in hydroxyl radicals–generating systems for 3 h at room temperature. Values with different letters (a–e) are significantly different (p < 0.05), which was concluded by SPSS software. In statistical analysis process, the effect of random error can be compared by probability value (p). If p < 0.05, it means that the effect of random error could be ignored and the difference of the values in the Figure 6 are significative. Otherwise, values with or within same letters (b and bc, or c and bc) are not significantly different (p > 0.05). All data analysed in this figure are included in the supplementary information files.

