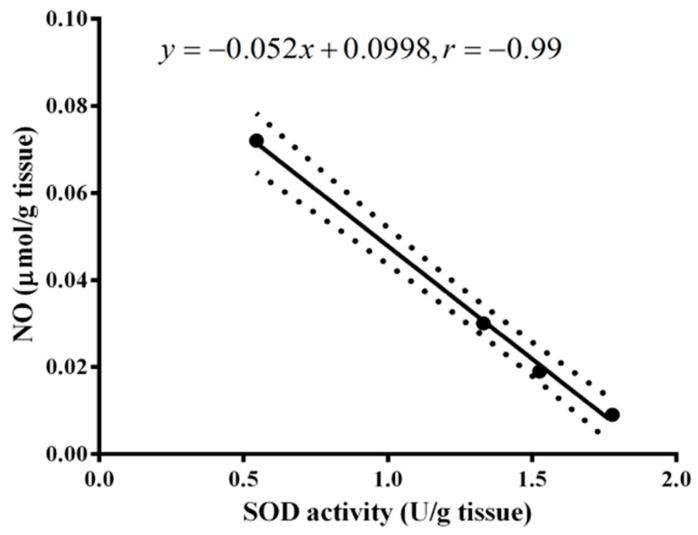
Figure 10.
Relationship between brain NO and SOD levels two months following MSG administration of all the experimental groups. The correlation coefficient is −0.99, i.e., an inverse relationship between the NO and SOD at two months post-treatment. The distance between the dotted curves is the correlation area which involves the data and the line represents the regression strength indicator, i.e., the close the data to linear line, the strong the correlation.

