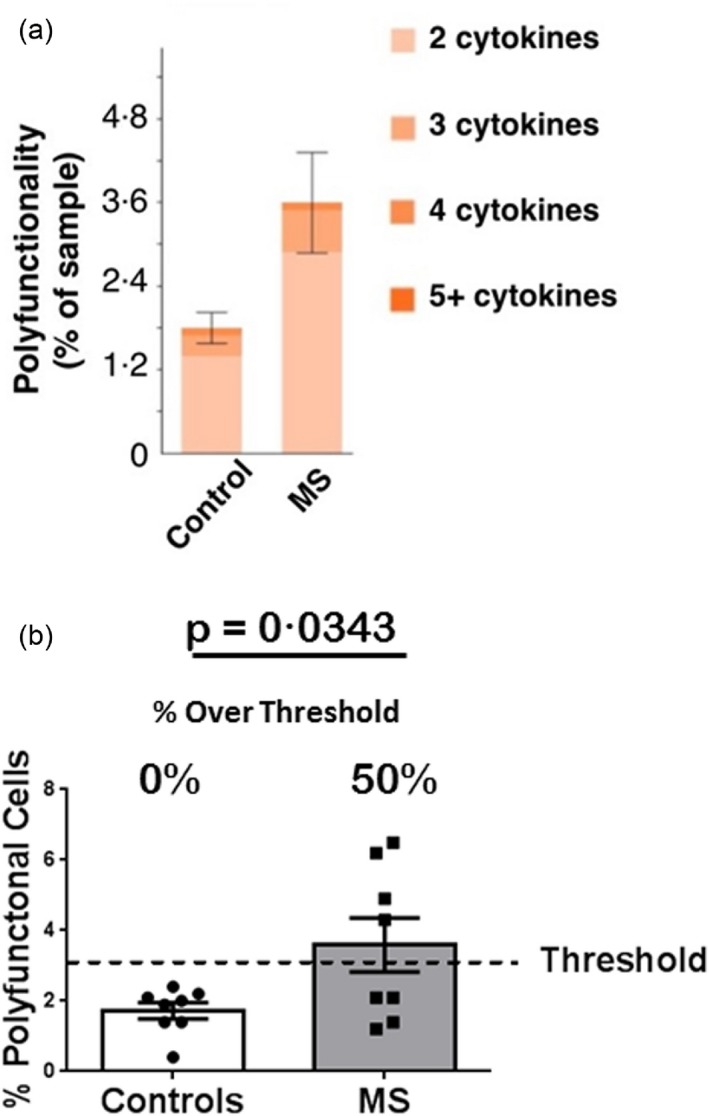
Figure 6.

Pam3CSK4 (P3C)‐stimulated single‐cell analysis. Polyfunctionality. CD14+ monocytes from the subjects depicted in Fig. 5 were stimulated for 24 h with P3C and assayed for polyfunctionality (cells secreting two or more cytokines). (a) The mean percentage of CD14+ monocytes secreting two or more cytokines in the control and total multiple sclerosis (MS) cohorts are stratified further by the percentage of cells secreting two, three, four or five cytokines. Error bars represent standard errors of the mean. (b) The percentage of CD14+ monocytes that are polyfunctional (secrete two or more cytokines); mean = 1·725% for controls; mean = 3·587% for total MS patients; P = 0·0343 via Student's t‐test. Error bars represent standard errors of the mean. The percentage of polyfunctional cells representing the upper threshold of control responses [based on the control interquartile range (IQR)] is depicted by the dashed line. The percentage of responses above threshold is depicted for controls and total MS patients.
