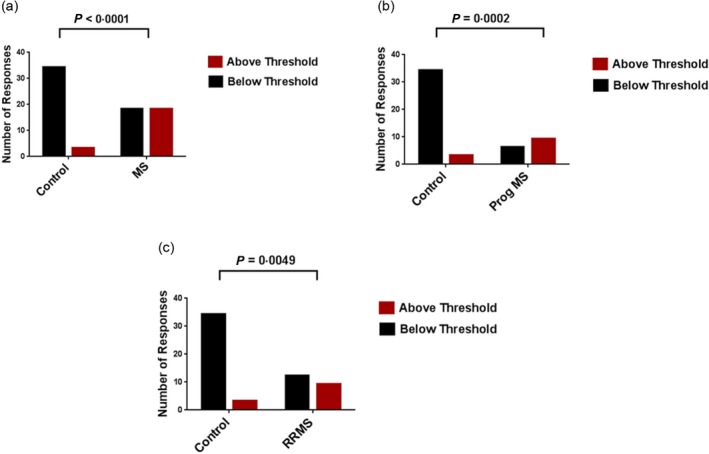
Figure 7.

Total Toll‐like receptor (TLR)2 responses above and below the interquartile range (IQR)‐based threshold of control responses. Total TLR2 responses were compiled from controls and multiple sclerosis (MS) patients throughout all approaches (37 total control TLR2 responses; 36 total MS TLR2 responses) and separated into those above or below the upper threshold in each assay [the interquartile range (IQR)‐based upper threshold of control responses defined in each study]. The proportion of responses above and below the threshold were then compared between: (a) control responses and total MS patient responses; (b) control responses and progressive (Prog) MS patient responses; and (c) control responses and relapsing–remitting MS (RRMS) patient responses. The results were analysed using Fisher's exact test.
