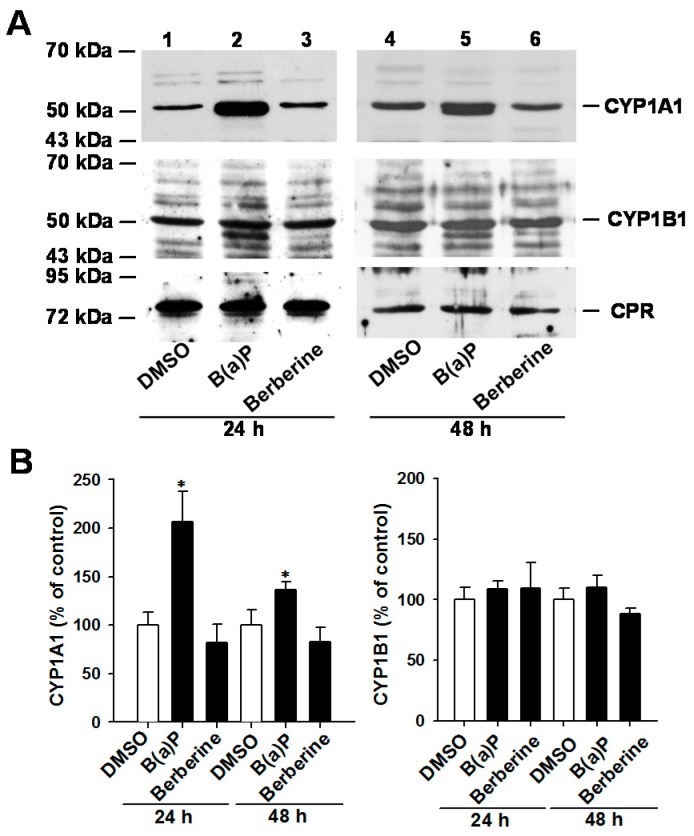
Figure 3.
Immunoblot analyses of CYP1A1, CYP1B1 and CPR in the control, B(a)P (2 μM)- and berberine (10 μM)-treated MCF-7 cells. The vehicle control cells were exposed to the same amount of DMSO. After exposure to these chemicals, crude membrane fractions were prepared from cell lysate and subjected to electrophoresis. Immunoblot analysis was performed as described in the section of Methods. Panel (A) shows the representative blots; the band intensities of the blots were analyzed and the relative percentage to the control cells is shown in Panel (B). Results represent the mean ± SD of 3 separate experiments. * p < 0.05, compared with the control cells.

