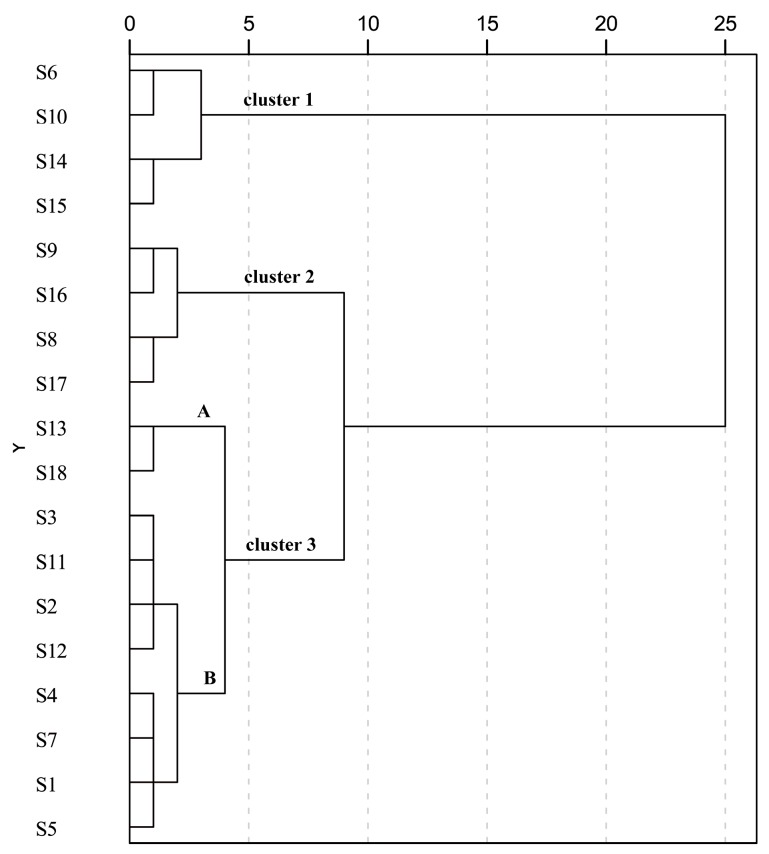
Figure 4.
Dendrogram of hierarchical cluster analysis for leaf samples S1–S18 of C. paliurus (detailed geographical information for S1–S18 is listed in Table 1). A and B represent two subgroups under cluster 3 based on the squared Euclidean distance.

