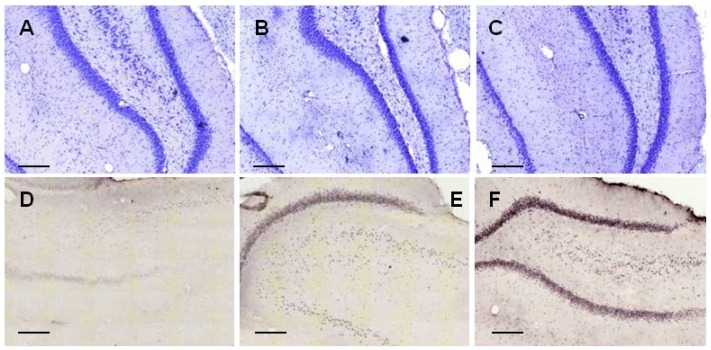
Figure 5.
Representative coronal examples of hippocampcal sections stained with cresyl-violet (first row) to show the presence of neuron number (first row) and with tau-antibody to show the presence of abnormally aggregated NFTs (second row). (A,D): control group; (B,E): 24 h aggregated 25 μM amyloid treated group; (C,F): 168 h aggregated 25 μM amyloid treated group. Scale bar: 200 µm.

