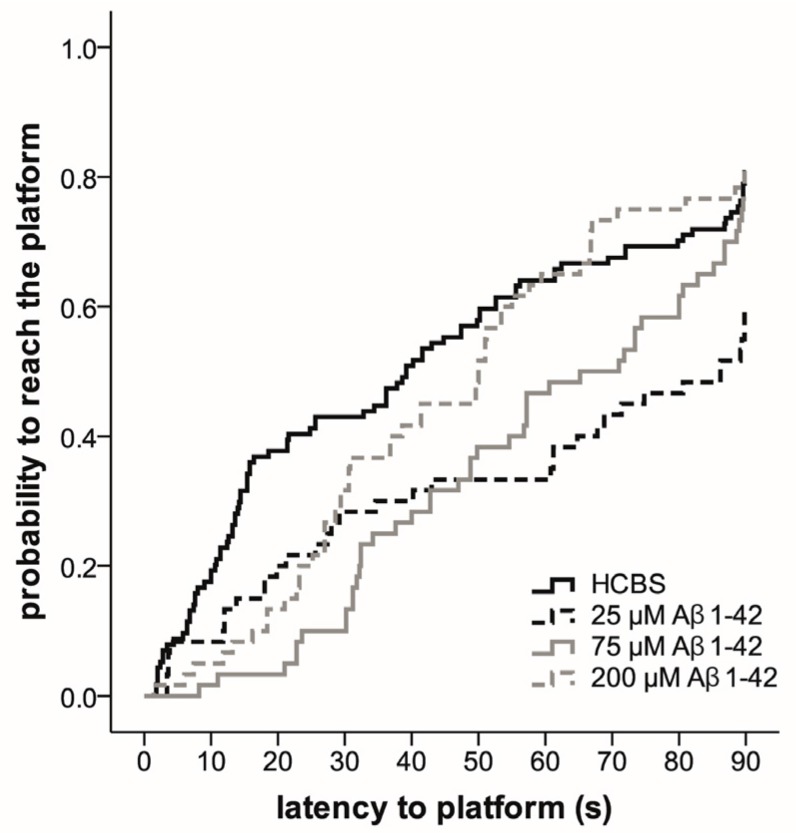
Figure 10.
Effect of different aggregation concentrations (25, 75 and 200 µM) of synthetic Aβ1-42 (168 h time) on Morris water maze performance. The fitted survival curves using the Cox Proportional Hazard model represents the probability that animals find the platform during a trial, capped at 90 s. We compared HCBS versus 25 µM oAβ1-42 (p = 0.001), HCBS vs. 75 µM oAβ1-42 (p = 0.053), and HCBS versus 200 µM oAβ1-42 (p = 0.534) treatment groups using log-rank tests (n = 12/group, except HCBS group, where n = 23).

