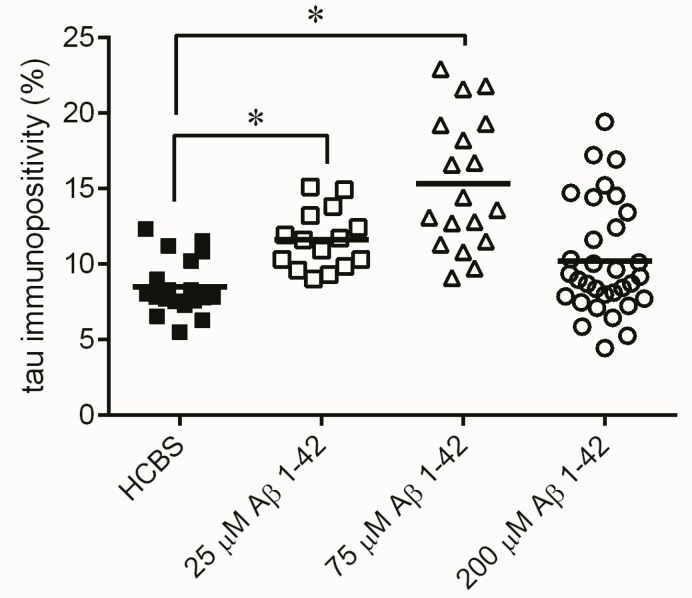
Figure 14.
Tau-immunostaining of hippocampal slices after treatment of 168 h aggregated Aβ assemblies using increasing aggregation concentrations (25, 75 and 200 µM) of synthetic Aβ1-42. Each dot represents the counted raw data, while horizontal bars indicate mean values. Increasing number of tau immunopositive cells were observed comparing the HCBS and the 25 µM oAβ1-42 treated (p < 0.001), as well as the HCBS and the 75 µM oAβ1-42 treated groups (p < 0.001). There is no significant difference between HCBS and 200 µM oAβ1-42 treated groups (p = 0.284), n = 4, 4 slices/animal; n refers to the number of animals per group. Statistical significance was determined by one-way ANOVA, followed by a Games–Howell post hoc test. * Differences with a p-value < 0.05 were considered significant.

