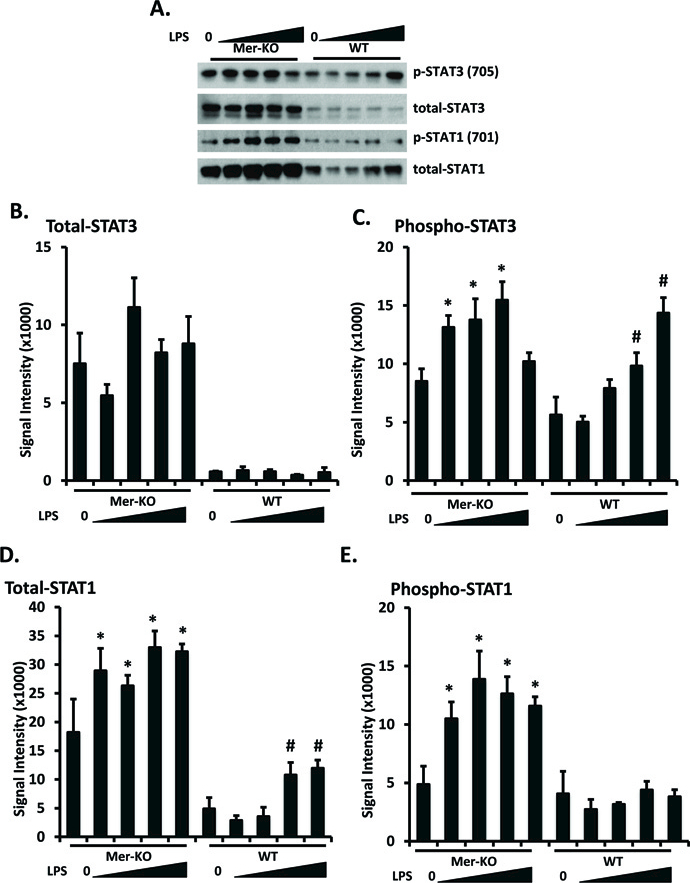
Figure 4. Mer inhibits STAT expression and phosphorylation in LPS-treated GECs.

Primary GECs were prepared, cultured, and LPS-treated as in figure 2. STAT1 and STAT3 expression and phosphorylation were analyzed by Western immunoblotting. Representative blots were shown in A. Experiments were repeated independently at least three times. Densitometry analyses to quantify the intensity of total STAT1 and STAT3 are shown in B and C. Values are the median and interquartile range. The Mann-Whitney test was used to determine statistical significance. *p<0.05, **p<0.01, Mer-KO LPS treated versus untreated; ##p<0.01, ###p<0.001, WT LPS versus WT untreated.
