
Figure 5. LPS-induced upregulation of SOCS3 expression in GECs is Mer-dependent.
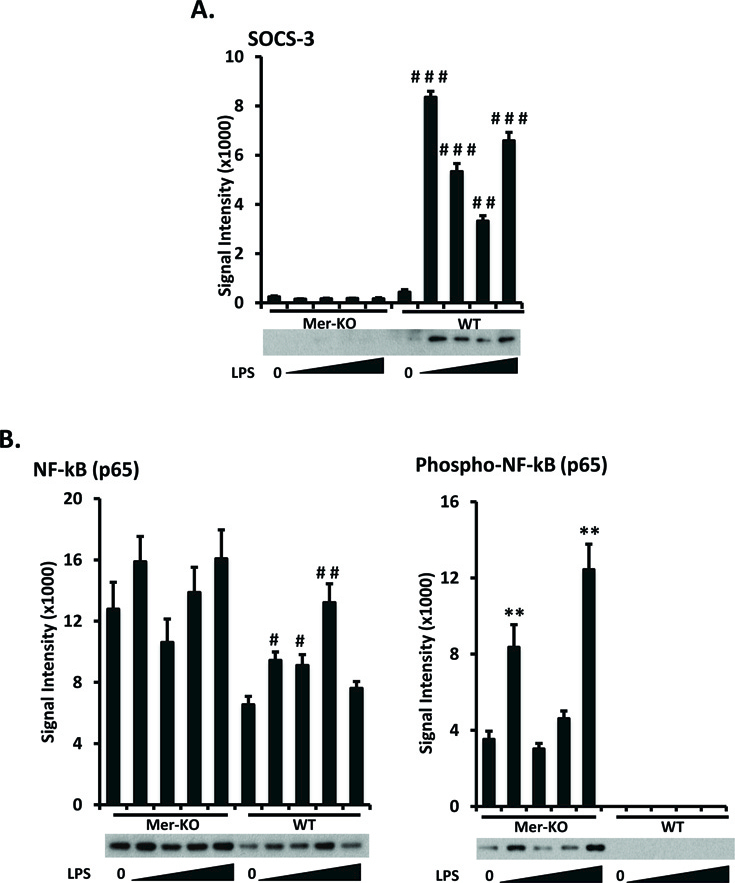
Primary GECs were prepared, cultured, and LPS-treated as in figure 2. A. Expression levels of SOCS3 were analyzed by Western immunoblotting. B. The expression and activation (phosphorylation) levels of NF-κB p65 subunit were analyzed and quantified. Representative Western blot images are shown. Experiments were repeated independently at least three times. Densitometry analyses to quantify the intensity of SOCS3 and NF-κB p65 are shown. Values are the median and interquartile range. **p<0.01, Mer-KO LPS treated versus untreated; #p<0.05, ##p<0.01, ###p<0.001, WT LPS-treated versus untreated, Mann-Whitney U test.