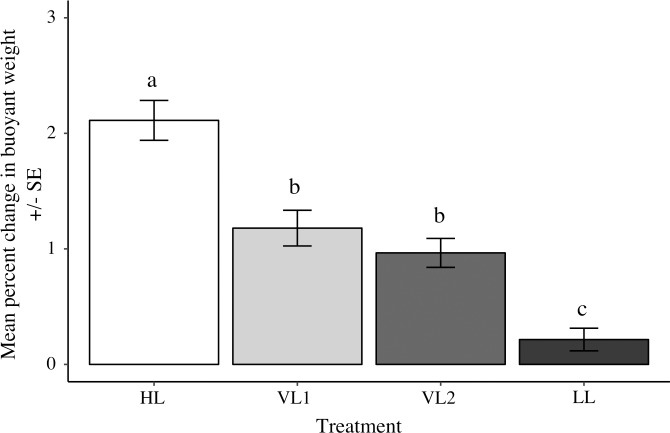
Fig 5. Relative growth of Acropora millepora between constant and variable DLI treatments.
Mean percent change of Acropora millepora buoyant weight in the high DLI (HL, white), low DLI (LL, black), and two variable DLI treatments (VL1, light grey & VL2, dark grey) after 12 days. Tukey HSD post-hoc results from one-way ANOVA comparisons superimposed. Error bars represent standard error, n = 16 per treatment.

