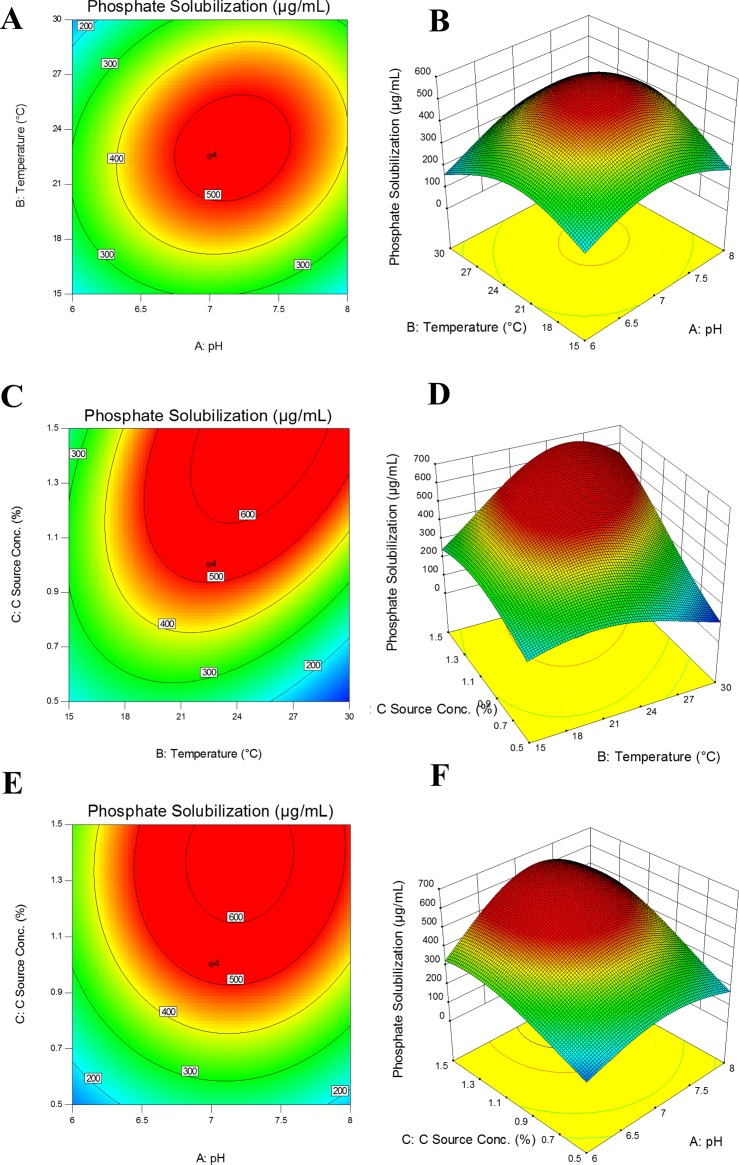
Fig 5.
Interaction among Temperature, pH and phosphate solubilizationusing Response surface (B,D,F) and contour (A,C,E) plotsat constant inoculums size (~ 5 x 10⁹ CFU mL-1) Contour plot (a) and Response surface plot (b) depicting effect of mutual interaction of temperature and pH on Phosphate solubilization (%) at constant inoculum size (~ 5 x 10⁹ CFU mL-1) and 5 mg L-1 initial concentration of tri-calcium phosphate. There were three replicates for each treatment. A three factor/five level central composite design (CCD) full factorial with 18 runs was employed by using Design Expert software (trial version 10, Stat-Ease, Inc., MN, USA).

