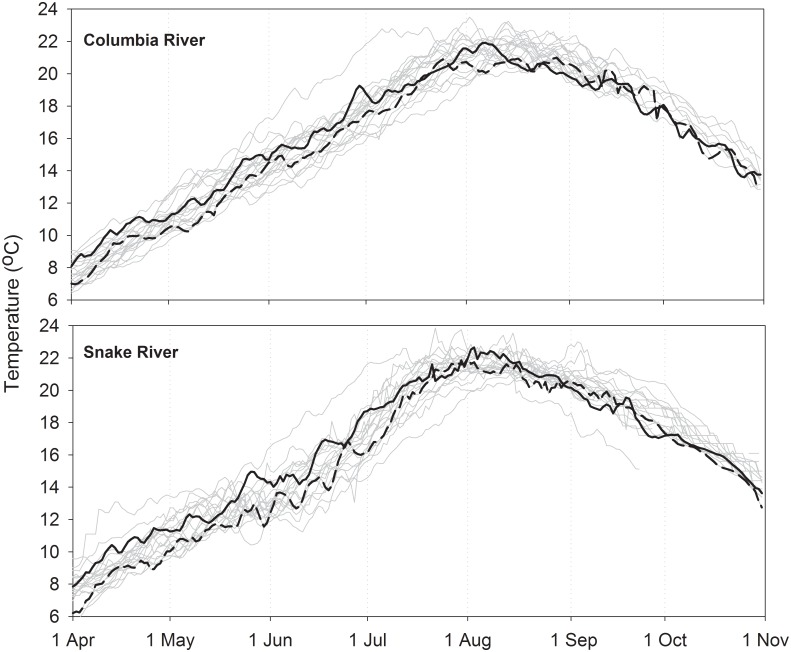
Fig 3. Mean daily Columbia and Snake River water temperatures.
Data collected at the Bonneville Dam (top) and Ice Harbor Dam (bottom) water quality monitoring sites from 1996–2015. Solid and dashed black lines show 2000 and 2002 data, respectively. Data were not collected in parts of September and October of several years. Source: U.S. Army Corps of Engineers, archived by University of Washington: www.cbr.washington.edu/dart/.

