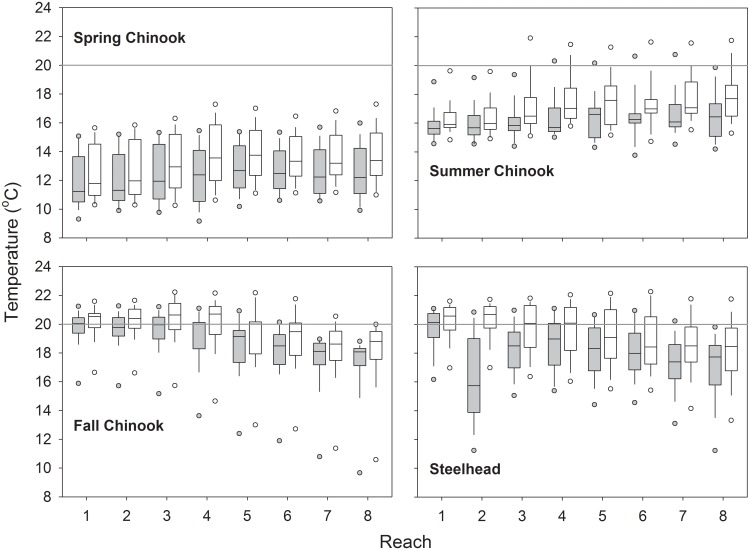
Fig 5. Reach-specific Chinook salmon and steelhead body temperatures.
Box plots show 5th, 10th, 25th, 50th, 75th, 90th and 95th percentiles of mean (gray boxes) and maximum (white boxes) body temperatures in the eight study reaches, 2000 and 2002 combined. See Table 2 for sample sizes.

