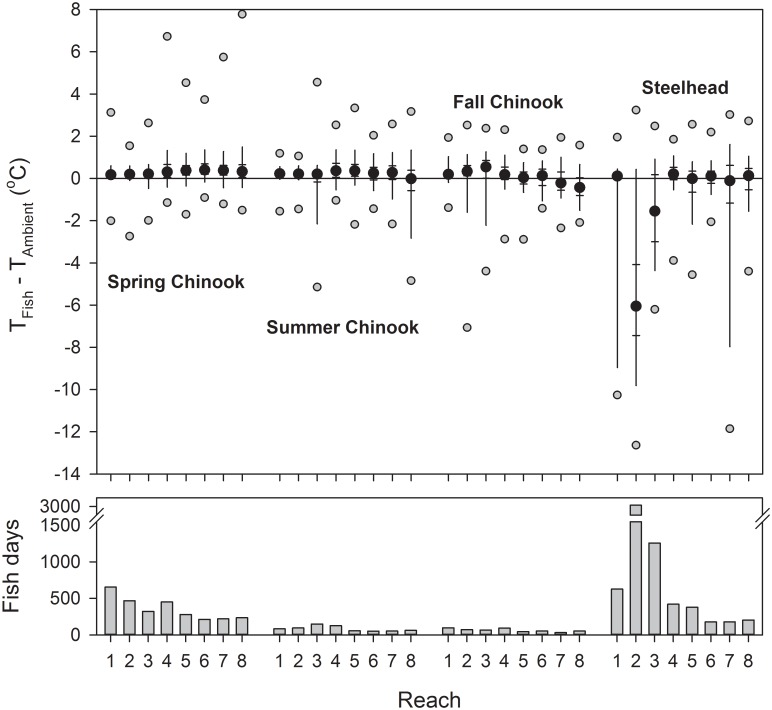
Fig 6. Fish temperatures versus river temperatures.
Differences between body temperatures of Snake River Chinook salmon and steelhead (TFish) and mean daily Columbia and Snake River water temperature at the nearest WQM site (TAmbient), by reach, 2000 and 2002 combined. Top plot shows 5th, 25th, 50th, 75th, 95th percentiles (black dots and whiskers) plus minimum and maximum (grey circles) differences. Bottom plot shows the total numbers of days fish spent in each reach (Fish days).

