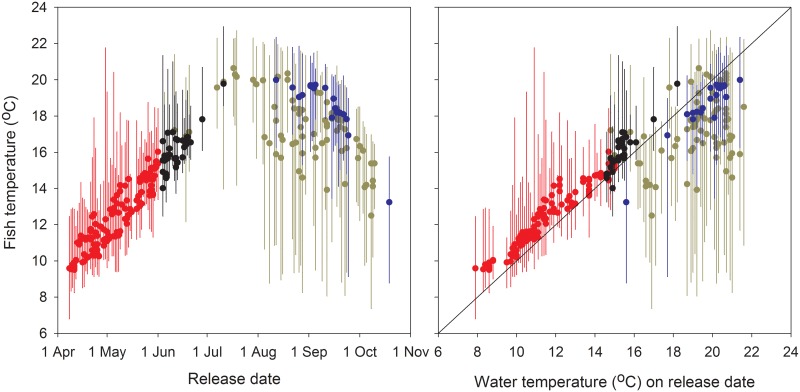
Fig 8. Range of fish temperature exposure over their full migration.
Individual Snake River Chinook salmon and steelhead mean, minimum, and maximum body temperatures during the ~470 rkm migration from release to Lower Granite Dam in relation to release date (left panel) and Columbia River water temperature on their release date (right panel) in 2000 and 2002. Red symbols are for spring Chinook salmon (n = 126); black symbols are for summer Chinook salmon (n = 34); blue symbols are for fall Chinook salmon (n = 21); and gold symbols are for summer steelhead (n = 75).

