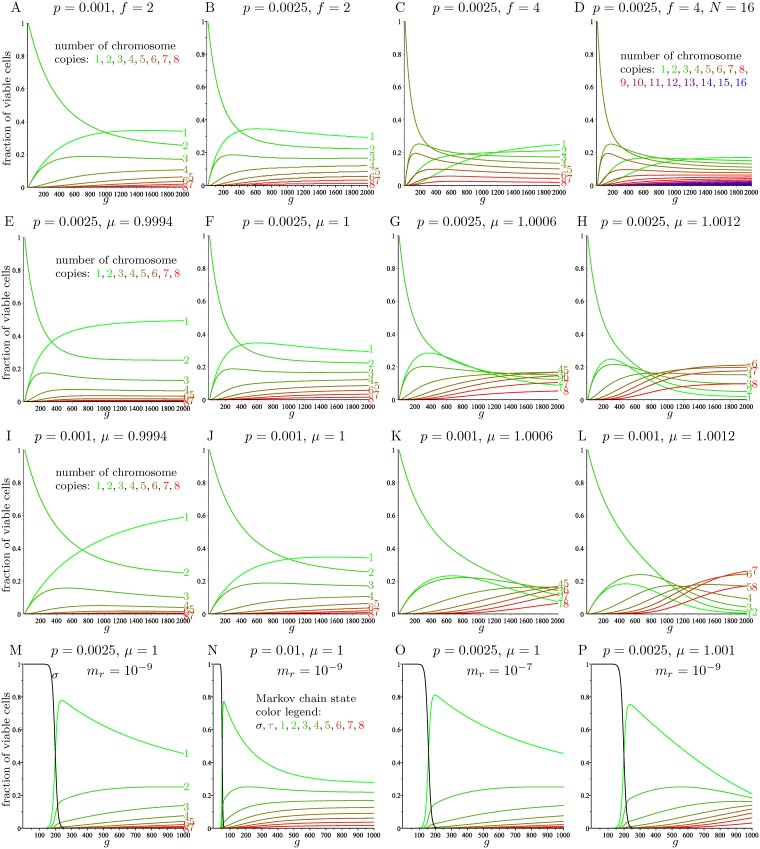
Fig 4. The evolution of the distribution of the number of chromosome copies for the various models.
Each curve represents a given number of copies. A—D: Basic model () with N = 8 (except in D, which uses N = 16), over 2000 generations. E—L: Full model with chromosome scores () with N = 8 and a founder cell with f = 2 chromosome copies, over 2000 generations. M—P: Modified model incorporating the effects of aneuploidy during early tumor growth () with N = 8 and a founder cell with 2 active copies of gene X, over 1000 generations.

