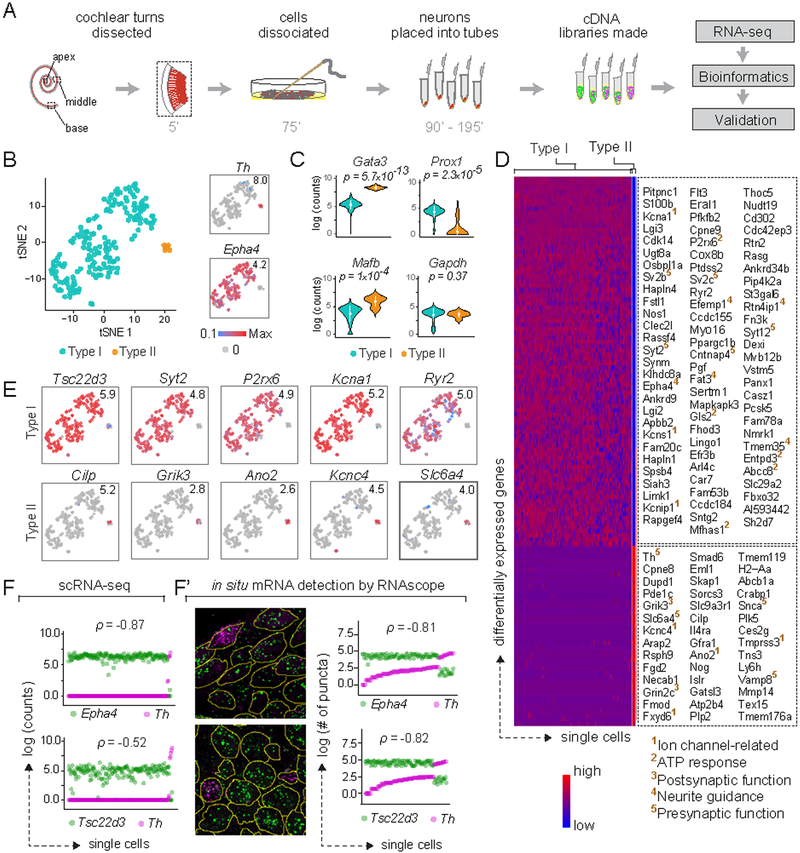
Figure 1: Type I and II SGNs can be detected as molecularly distinct cell populations using scRNA-seq.
(A) Workflow for single cell RNA-seq (scRNA-seq) of spiral ganglion neurons (SGNs). Numbers indicate time elapsed (in minutes) since animal euthanization. (B) t-stochastic neighbor embedding (tSNE) of neuronal profiles (n = 186, 11 P25–P27 animals) revealed several clusters. Clusters of Type I (blue) and II (orange) SGNs were identified by expression of Epha4 and Th, respectively (insets). In this and all subsequent plots, numbers in the upper right corner indicate highest expression (Max) observed for each gene. (C) Violin plots comparing gene expression among Type I and II SGNs illustrate increased expression of Gata3 and Mafb in Type II SGNs (p = 5.7×10⁻¹³ and 1×10⁻⁴, respectively), and of Prox1 in Type I SGNs (p = 2.3×10⁻⁵), with no difference in expression of the housekeeping gene Gapdh (p = 0.37). White dot and bar indicate mean and standard deviation, respectively. (D) Heat map showing genes expressed differentially between Type I and II SGNs, with examples of Type I-enriched (top panel) and Type II-enriched (bottom panel) genes listed on the right. Superscripted numbers indicate gene functional groups annotated manually. (E-F) Several genes exhibit binary ON/OFF expression between the two subtypes (E), with clear correspondence between scRNA-seq (F) and RNAscope (F’) quantification in P25–P27 tissue sections for Epha4 and Th, as well as the novel Type I marker Tsc22d3. In images showing RNAscope puncta (F’), SGN cell bodies are outlined in yellow as visualized by immunostaining for parvalbumin (not shown). In scatterplots (F, F’), the two dots in each column indicate counts for two different genes in the same neuron, and neurons are sorted along the X-axis by the level of the gene in magenta. p represents Pearson’s correlation coefficient. See also Fig. S1.

