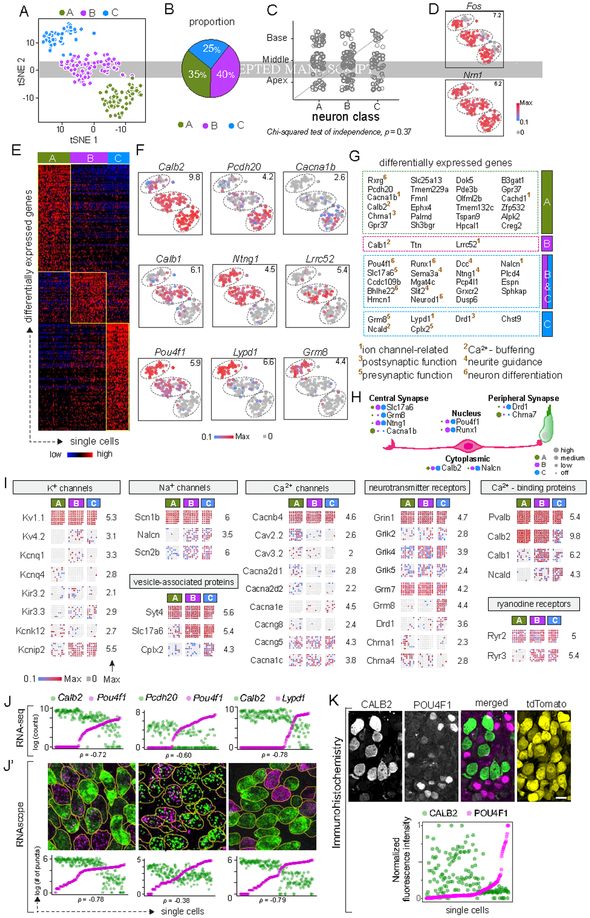
Figure 2: Three molecular subtypes of Type I SGNs exist in the mouse inner ear.
(A-B) tSNE embedding of Type I SGN transcriptomes (A) depicting three clusters — A, B, C — predicted by graph-based clustering, which are indicated by dot color. Overall proportions are illustrated in B. (C-D) SGN subtypes are present in all regions of the cochlea (C) and show expression of the activity-induced genes Fos and Nrn1 in all clusters (D). (E-G) The clusters exhibit broad differences in their transcriptomes, illustrated in a heat map for the top 100 differentially expressed genes (E) and in tSNE plots for individual genes that show subtype-specific expression patterns (F). Numbers in the upper right corner indicate highest expression (Max) observed for each gene. (G) Genes enriched across the three subtypes encode proteins associated with many aspects of neuronal differentiation and function. Superscripted numbers indicate gene functional groups annotated manually. (H) Examples of differentially expressed genes that encode proteins localized to different neuronal compartments, indicating that input and output properties vary among SGNs. For each gene, expression level among SGN subtypes is indicated by the size of each colored dot. (I) Expression of select genes relevant to neuronal physiology is illustrated in dot matrix plots of individual libraries, which are grouped by subtype. Some genes are expressed uniformly across all libraries (top row for each group), whereas others vary across subtypes (all other rows). Numbers on the right indicate the highest expression (Max) observed for each gene. (J-K) Differentially expressed genes identified by scRNA-seq (J) showed the same patterns of expression in individual SGNs analyzed by RNAscope of P25–P27 tissue sections (J’). SGN cell bodies are outlined in yellow as visualized by immunostaining for parvalbumin (not shown). Similarly, immunostaining (K) for CALB2 (calretinin) (green), POU4F1 (magenta) and tdTomato (yellow) in tissue sections of P25–P27 bhlhb5Cre/+: Ai14/+ mice revealed inverse gradients of CALB2 and POU4F1 expression, quantified below. In scatterplots (J, J’, K), the two dots in each column indicate expression levels of two different markers in the same neuron, and neurons are sorted along the X-axis by the level of the gene in magenta. Scale bars: 10 μm (K). See also Fig. S1, S2, S3.

