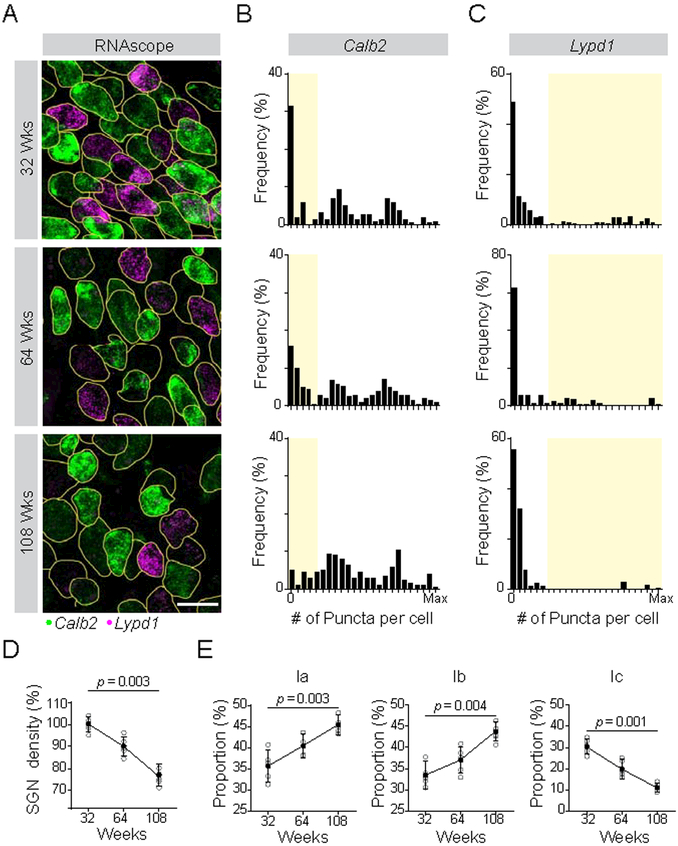
Figure 5: Type I SGN subtypes show differential vulnerability to age-related hearing loss.
(A) SGN subtype identity was assessed using RNAscope to quantify levels of Calb2 and Lypd1 transcripts at 32, 64 and 108 weeks, shown in representative tissue sections. (B-C) Histograms show the frequency distribution of Calb2 (B) and Lypd1 (C) mRNA levels for all analyzed SGNs at each age (n = 212 at 32 weeks (top), 175 at 64 weeks (middle), 155 at 108 weeks (bottom)). The Type Ic population, defined by low levels of Calb2 and high levels of Lypd1, is shaded in yellow. (D-E) SGN density (% relative to the 32 wk time point) decreases over time (D) and this loss is matched by a decrease in the proportion of Ic SGNs (E). Type Ia and Ib SGNs increase in proportion over the same time frame, indicating that loss of Ic SGNs likely accounts for the overall decrease in density. P values indicate results of Dunn’s test following one-way ANOVA for 5 animals. Scale bar: 10 μm (A). See also Fig. S6.

