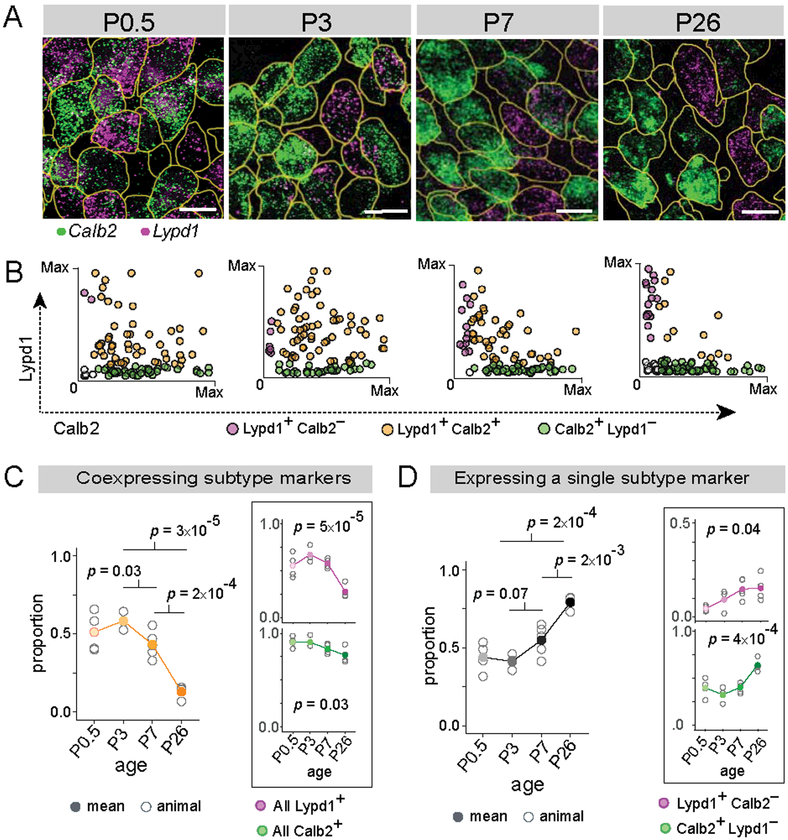
Figure 6: Type I SGN subtypes emerge gradually over the first postnatal week.
(A-B) Representative images of Calb2 (green) and Lypd1 (magenta) mRNA detected using RNAscope in tissue sections of cochlea at various developmental stages (A). Scatterplots (B) show expression levels of Calb2 alone (green), Lypd1 alone (magenta) or both markers (orange) in individual SGNs (n = 100 randomly selected cells at each time point). (C-D) Over time, the proportion of cells expressing both Calb2 and Lypd1 decreases (orange, B, C), shown also for expression of each gene individually (magenta and green, insets). In parallel, there is an increase in the proportion that express a single subtype marker (D), shown for the whole population (black), as well as separately for Lypd1+ only SGNs (magenta, inset) and Calb2+ only SGNs (green, inset). Means are shown in solid dots, with raw data from each individual animal in open circles. P values indicate results of Tukey’s HSD test (left) and one-way ANOVA (right, inset). Scale bars: 10 μm (A).

