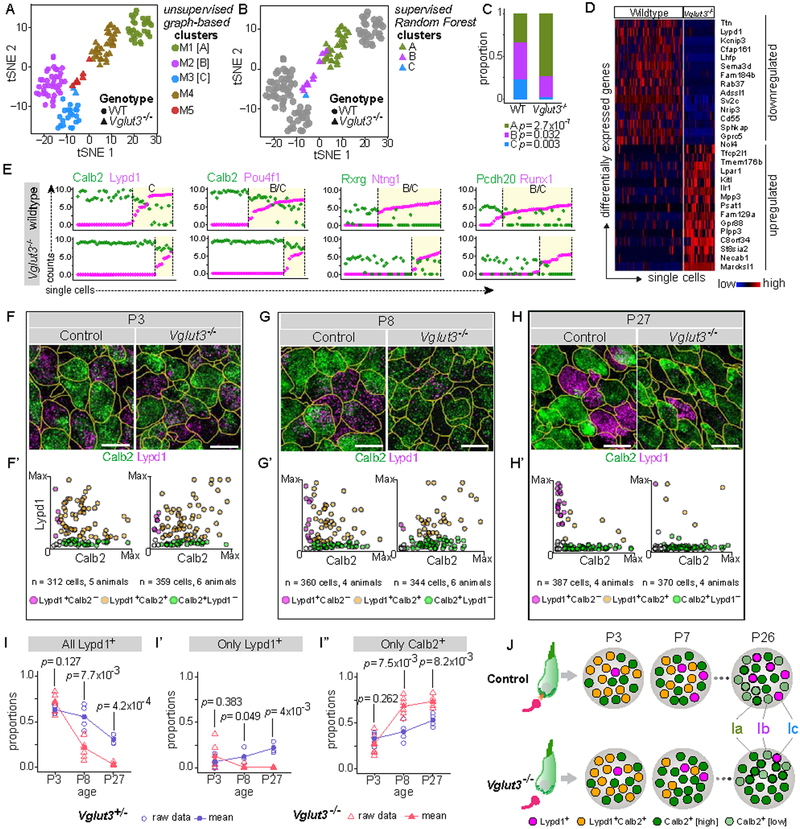
Figure 7: SGN heterogeneity is altered in a mouse model of congenital deafness.
(A) tSNE embedding of single cell transcriptomic profiles from wildtype (WT, circles) and Vglut3−/− (triangles) animals, with 5 distinct clusters (M1–M5) predicted by graph-based unsupervised clustering indicated by color. M1, M2 and M3 correspond to WT Ia, Ib, and Ic SGNs, respectively, whereas M4 and M5 consist of SGNs from Vglut3−/− animals. (B) Subtype identities of neurons from Vglut3−/− animals were assigned using supervised clustering by the Random Forest method. WT cells are shown in grey, and cells from Vglut3−/− animals are shown in colors corresponding to their predicted subtype identities. Cluster M4 (brown, A) consists of Type Ia-like SGNs (green, B), whereas the remaining neurons in cluster M5 (red, A) are either more like Type Ib (purple, B) or Type Ic (blue, C) SGNs. (C) Subtype proportions are significantly altered in Vglut3−/− animals compared to WT, with a dramatic loss of Ic SGNs. P values indicate results of Test of Equal Proportions between Ia, Ib, and Ic subtypes in the two genetic backgrounds. (D-E) SGNs from WT and Vglut3−/− animals show broad differences in gene expression reflective of a shift from Ic to Ia identity, shown both in a heatmap (D) and in scatterplots (E) of the level of expression of Ia (Calb2, Rxrg, Pcdh20) and Ib/Ic (Lypd1, Pou4f1, Ntng1, Runx1) subtype markers (WT, top; Vglut3−/−, bottom). Yellow shading marks cells belonging to B/C or C clusters. (F-H) RNAscope of tissue sections from P3 (F), P8 (G), and P27 (H) WT (left) and Vglut3−/− (right) animals shows that expression of Calb2 (green) and Lypd1 (magenta) initiates normally at P3, quantified in F’. However, the proportion of Lypd1+ SGNs is decreased at P8 (G’), and there are almost no Lypd1+ SGNs remaining at P27 (H’). Scatterplots (F’-H’) show individual cells expressing Calb2 alone (green), Lypd1 alone (magenta) or co-expressing both markers (orange). (I-I”) Proportions of SGNs in control (blue circles) and Vglut3−/− (red triangles) animals that express any Lypd1 (I), that express only Lypd1 (I’), or that express only Calb2 (I”). Means shown in solid symbols, with raw data from individual animals in open symbols. P values refer to results of independent samples t-test between the two genetic backgrounds at each time point. (J) Schematic showing developmental emergence of mutually exclusive expression between Calb2 and Lypd1. In Vglut3−/− animals, in which glutamate release from IHCs is abolished, Lypd1+ SGNs are severely underrepresented compared to control animals, beginning after P3, resulting in overabundance of Ia SGNs by the fourth postnatal week. See also Fig. S7. Scale bars: 10 μm (F-H).

