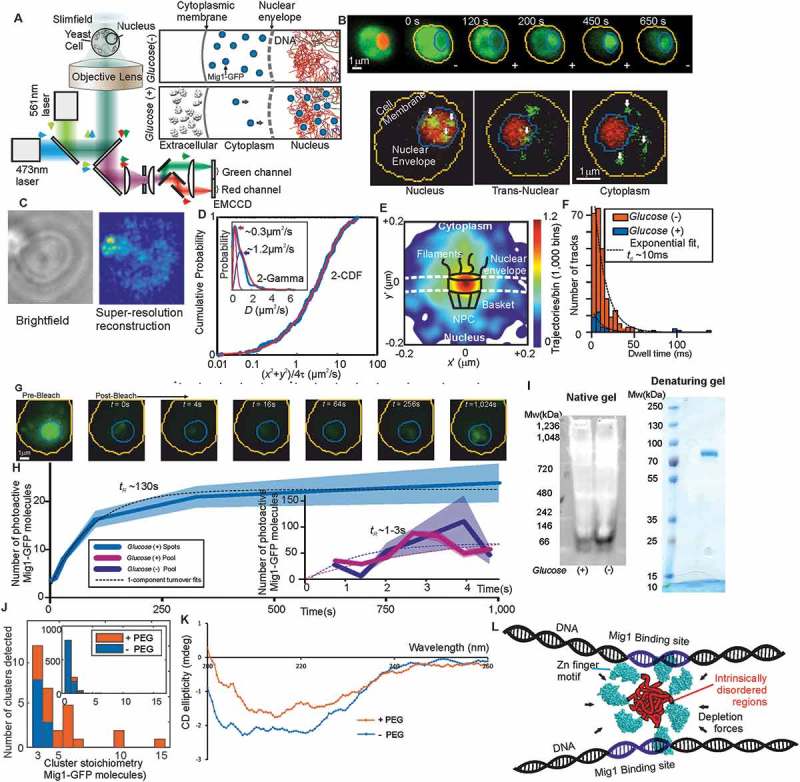
Figure 1.

TFs form clusters in eukaryotic cell. (a) Schematic of millisecond Slimfield microscopy. (b) Fluorescence imaging of Mig1-GFP (green) with nucleus indicated (red) by Nrd1-mCherry, showing different cellular locations, stoichiometry determined by step-wise photobleaching that can be measured using Fourier analysis and edge-detection filters [52,79,80]. (c) STORM imaging using Mig1-mEos2. (d) Mobility analysis for cumulative distribution function (CDF) and Gamma fits. (e) Mig-GFP localization through a nuclear pore complex. (f) Dwell time for tracks translocating the nuclear envelope. (g) Images and (h) analysis for FRAP indicating turnover of nuclear Mig1-GFP. (i) Native and denaturing gels on purified Mig1-GFP. (j) Mig1-GFP cluster stoichiometry in presence/absence of molecular crowding. (k) Circular dichroism spectra in presence/absence of molecular crowding. (l) Cartoon model for shape of a Mig1 cluster in vicinity of DNA strands.
