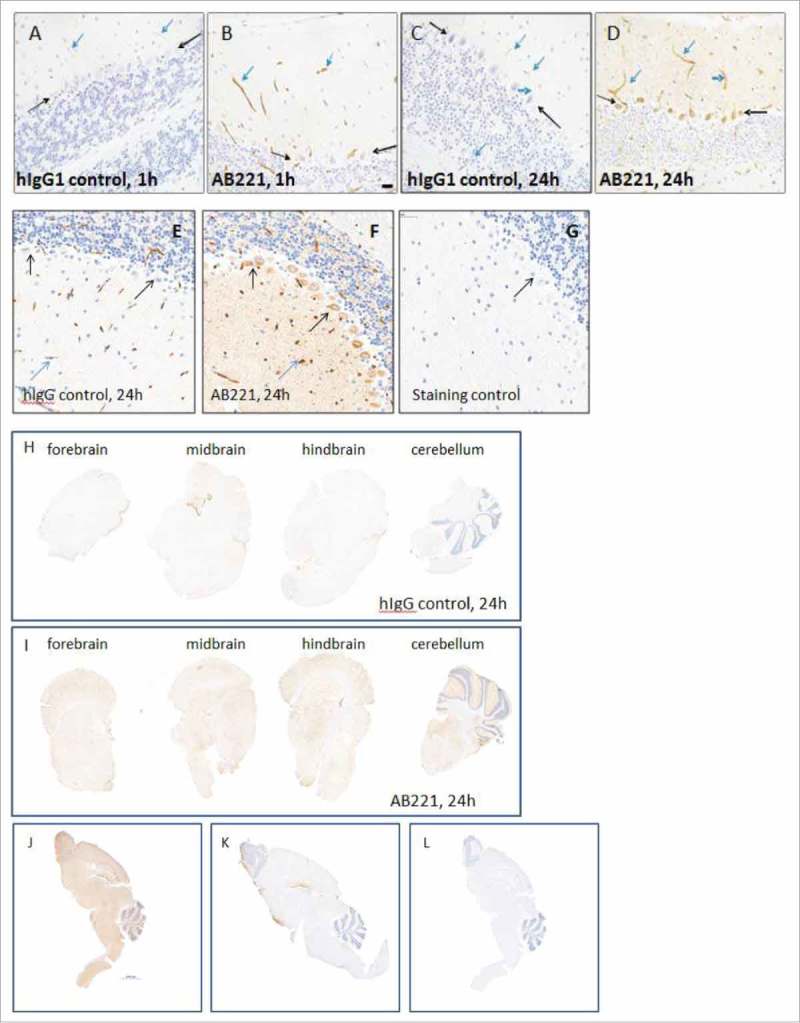
Figure 1.

Brain uptake and distribution of anti-TfR1 antibodies. (A-I) Representative images of IHC study of anti-TfR, AB221 and hIgG control antibody. Positive IHC staining of endothelial cells/vasculature (blue arrows), Purkinje cells (black arrows) in coronal sections of mice cerebellum 1 or 24 hours (B,D) after intravenous injection of 20 mg/kg AB221 was observed by staining of brain sections with donkey anti-human IgG. Same staining pattern of antibody distribution with another staining protocol using rabbit anti-human detection is also shown (F). Positive IHC staining of endothelial cells/vasculature (F, blue arrows), in coronal sections of mice cerebellum 1 or 24 hours after intravenous injection of 20 mg/kg IgG control was observed by staining of brain sections with donkey anti-human IgG (A and C) or staining with rabbit anti- human antibody (E). Location of Purkinje cells, which shows negative staining, in IgG control is also indicated by black arrows (A and C). Rabbit anti-hamster was used as staining control (G). Representative images of coronal section of forebrain, midbrain, hindbrain and cerebellum regions show enhanced overall brain uptake of AB221 (I) compared with hIgG (H) using rabbit anti-human staining. (J-L) Representative images of IHC staining of sagittal section of whole brain with rabbit anti-human detection after an intravenous injection with either anti-TfR AB405 (J) or hIgG control antibody (K) at 20 mg/kg after 24 hours are shown. IHC staining of brain section with rabbit anti-hamster control indicates no non-specific staining (L). Scale bar equals 2000 μm.
