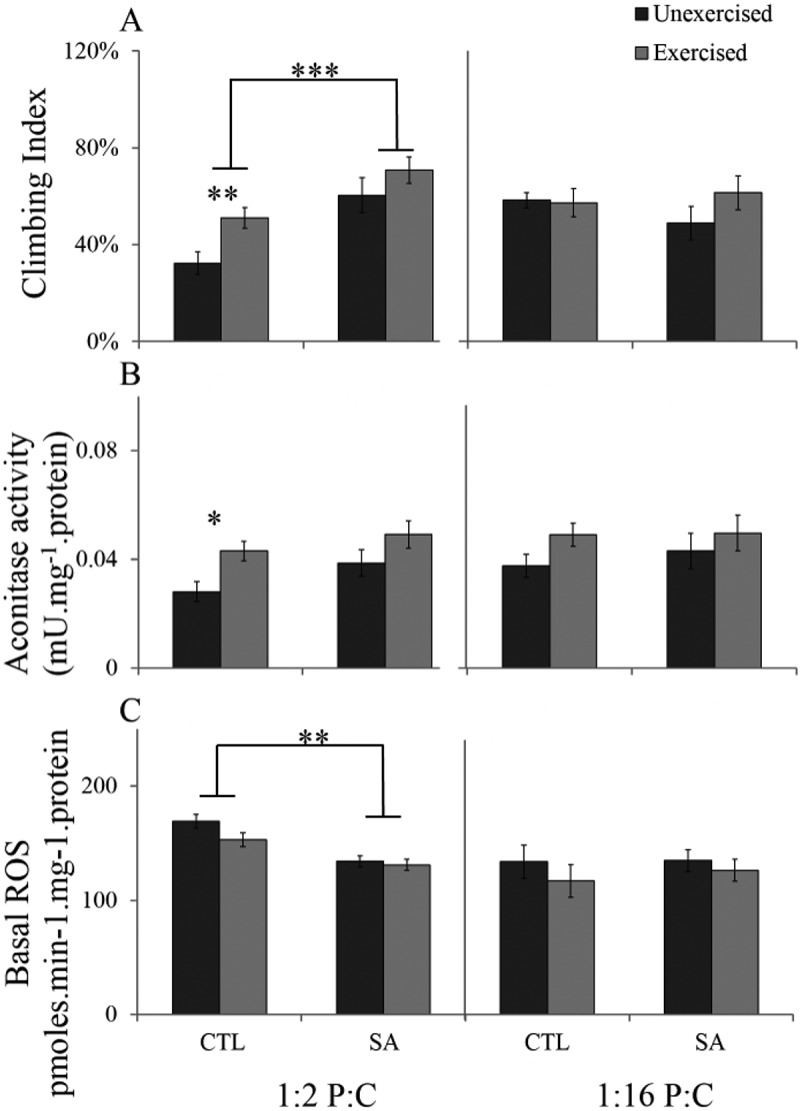
Figure 3.

Climbing index, aconitase activity and Basal ROS of unexercised and exercised parkin- males fed high Protein (1:2 P:C) and high Carbohydrate (1:16 P:C) ratio diet without (CTL) or with stearic acid (SA). A. Climbing. B. Mitochondrial aconitase activity. C Basal ROS. Bars indicate means and bars indicate s.e.m. Significance determined by Student’s t-test at *P < 0.05, **P < 0.01 and ***P < 0.001 (see text for details).
