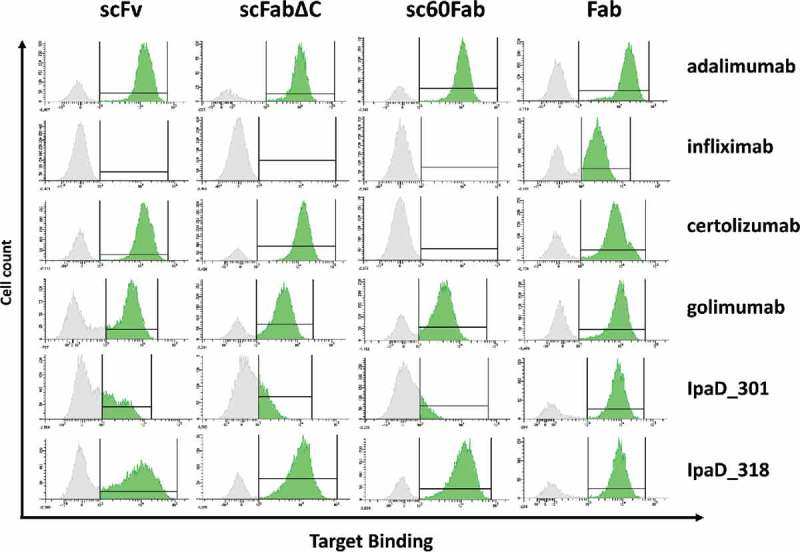
Figure 2.

Antigen binding of the 6 selected antibodies expressed as different antibody fragment formats on the surface of yeast cells. Cells are labeled with biotinylated antigen then with Streptavidin–PE (Target Binding) before FACS analysis. Selected antigen concentrations are far above the expected KD to reach a quantitative binding with the antibody fragments. Respective antigen concentration were 20 nM for anti-TNF antibodies and 50 nM for anti-IpaD antibodies. For each construct, a FACS histogram shows the fluorescence intensity corresponding to antigen binding (x-axis) vs the number of detected events (y-axis). Interval gates (bars) are shown to differentiate cells with detectable antigen binding (mean fluorescence intensity (MFI) score above 103, in green) from cells with no detectable antigen binding (MFI score under 103, in grey).The 103 cutoff has been obtained by measuring MFI of cells with a non-relevant antigen, cf. Supplementary figure 1.
