Figure 3.

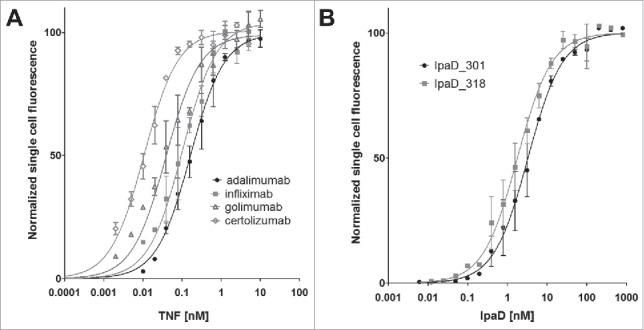
Affinity of Fab antibody fragments expressed on the surface of yeast cells. The mean fluorescence intensity (MFI), determined by FACS analysis, is plotted against varying concentrations of antigen for every Fab construct, and fit to a monovalent binding model. Measurements were done in triplicate with independent cultures and inductions. (A) Equilibrium binding constants KD of the four anti-TNF Fabs for TNF at 20°C. Curve fitting results in a KD of 114 ± 6 nM for adalimumab Fab, 102 ± 14 pM for infliximab Fab, 39 ± 4 pM for golimumab Fab and 11 ± 1 pM for certolizumab Fab. (B) Equilibrium binding constants KD of the two anti-IpaD Fabs for IpaD at 20°C. KD IpaD_301 Fab = 3.2 ± 0.3 nM, KD IpaD_318 Fab = 1.7 ± 0.2 nM.
