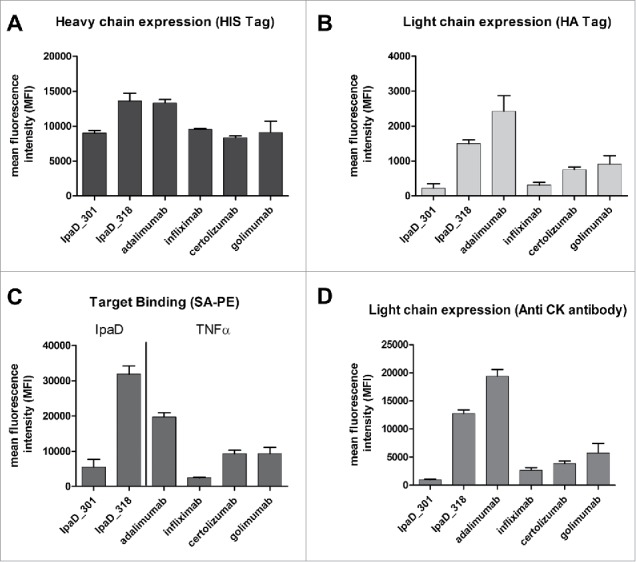
Figure 4.

Antigen binding and expression levels of heavy and light chains of the 6 selected antibodies expressed as Fab on the surface of yeast cells. Cells were labeled with the appropriate expression reporter and the mean fluorescence intensity of positive cells was determined by FACS analysis. For antigen binding, cells were double-labeled with biotinylated antigen and Streptavidin–PE (target binding) before FACS analysis. (A) Heavy chain expression evaluated with anti-HIS antibody reporter. (B) Light chain expression evaluated with anti-HA antibody reporter (C) Biotinylated antigen binding evaluated with Streptavidin-PE (D) Light chain expression evaluated with anti-CK antibody reporter. Measurements were made in triplicate using cells from independent cultures.
